


What is slope and the intercept for \[y = - \dfrac{1}{3}x + 1\] and how would you graph it?
Answer
556.5k+ views
Hint: Here in this question, we have to plot the graph for the equation using the slope and the intercept. By substituting the x is equal to zero we can find the y intercept value and substituting y is equal to zero we can find the x intercept value. By equating the given equation to the general equation of line we can determine the slope.
Complete step-by-step answer:
The given equation is in the form of \[y = mx + b\] , where m is slope and b is known as y-intercept. Slope means ratio of vertical change to the horizontal change i.e., ratio of change in y-axis or step size of y-axis to the change in x-axis or step size of x-axis. An intercept is a point where the straight line or a curve intersects the y-axis in a plane. If the point x is zero then the obtained point is a y -intercept.
Now consider the given equation \[y = - \dfrac{1}{3}x + 1\] -----------(1)
Substitute the value of x as 0 in equation (1), then we have
\[ \Rightarrow y = \dfrac{{ - 1}}{3}(0) + 1\]
On simplifying we get
\[ \Rightarrow y = 1\]
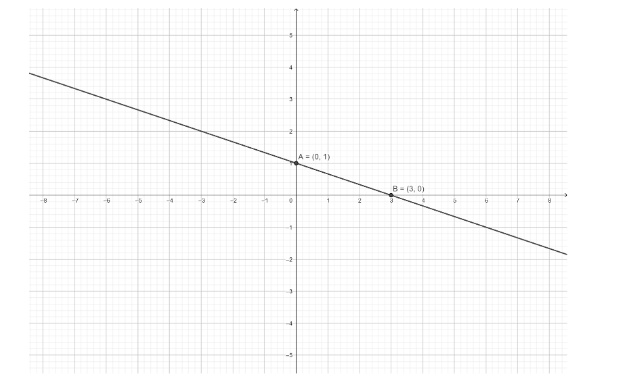
Therefore, y-intercept is (0, 1)
Substitute the value of y as 0 in the equation (1) then we have
\[ \Rightarrow 0 = \dfrac{{ - 1}}{3}x + 1\]
On simplifying we get
\[
\Rightarrow - 1 = \dfrac{{ - 1}}{3}x \\
\Rightarrow 1 = \dfrac{1}{3}x \\
\Rightarrow x = 3 \;
\]
Therefore, x-intercept is (3, 0)
The general equation of a line is given by \[y = mx + b\] , the b is the y-intercept and it is 1. On substituting we get \[y = mx + 1\] ------ (2)
On comparing the equation (1) and equation (2) we get
\[m = \dfrac{{ - 1}}{3}\]
Therefore, the slope is \[\dfrac{{ - 1}}{3}\]
The graph for this is given below
Note: The question is belonging to the concept of graph. By comparing the given equation to the equation of a line we calculate the slope and intercept. Or by choosing the value of x we can determine the value of y and then plotting the graphs for these points we obtain the result.
Complete step-by-step answer:
The given equation is in the form of \[y = mx + b\] , where m is slope and b is known as y-intercept. Slope means ratio of vertical change to the horizontal change i.e., ratio of change in y-axis or step size of y-axis to the change in x-axis or step size of x-axis. An intercept is a point where the straight line or a curve intersects the y-axis in a plane. If the point x is zero then the obtained point is a y -intercept.
Now consider the given equation \[y = - \dfrac{1}{3}x + 1\] -----------(1)
Substitute the value of x as 0 in equation (1), then we have
\[ \Rightarrow y = \dfrac{{ - 1}}{3}(0) + 1\]
On simplifying we get
\[ \Rightarrow y = 1\]
Therefore, y-intercept is (0, 1)
Substitute the value of y as 0 in the equation (1) then we have
\[ \Rightarrow 0 = \dfrac{{ - 1}}{3}x + 1\]
On simplifying we get
\[
\Rightarrow - 1 = \dfrac{{ - 1}}{3}x \\
\Rightarrow 1 = \dfrac{1}{3}x \\
\Rightarrow x = 3 \;
\]
Therefore, x-intercept is (3, 0)
The general equation of a line is given by \[y = mx + b\] , the b is the y-intercept and it is 1. On substituting we get \[y = mx + 1\] ------ (2)
On comparing the equation (1) and equation (2) we get
\[m = \dfrac{{ - 1}}{3}\]
Therefore, the slope is \[\dfrac{{ - 1}}{3}\]
The graph for this is given below
Note: The question is belonging to the concept of graph. By comparing the given equation to the equation of a line we calculate the slope and intercept. Or by choosing the value of x we can determine the value of y and then plotting the graphs for these points we obtain the result.
Recently Updated Pages
Master Class 11 Computer Science: Engaging Questions & Answers for Success
Master Class 11 Business Studies: Engaging Questions & Answers for Success
Master Class 11 Economics: Engaging Questions & Answers for Success
Master Class 11 English: Engaging Questions & Answers for Success
Master Class 11 Maths: Engaging Questions & Answers for Success
Master Class 11 Biology: Engaging Questions & Answers for Success
Trending doubts
One Metric ton is equal to kg A 10000 B 1000 C 100 class 11 physics CBSE
There are 720 permutations of the digits 1 2 3 4 5 class 11 maths CBSE
Discuss the various forms of bacteria class 11 biology CBSE
Draw a diagram of a plant cell and label at least eight class 11 biology CBSE
State the laws of reflection of light
Explain zero factorial class 11 maths CBSE