


How do you sketch the graph of $y={{\log }_{2}}\left( x-1 \right)$ ?
Answer
606.3k+ views
Hint: If we draw the graph of any function f(x) and shift the graph k units towards right , we will get the graph of f(x- k). If the function f(x) is ${{\log }_{2}}x$ the value of f(x –k) is equal to ${{\log }_{2}}\left( x-k \right)$. If we assume f(x) as ${{\log }_{2}}x$ and k as 1, to solve this question we will first draw the graph of ${{\log }_{2}}x$ and then we will shift the graph 1 unit towards right we will get the graph of $y={{\log }_{2}}\left( x-1 \right)$
Complete step-by-step answer:
We have to sketch $y={{\log }_{2}}\left( x-1 \right)$
We can draw the graph of ${{\log }_{2}}x$ then we will shift the graph of 1 unit towards the right. We will get the graph of $y={{\log }_{2}}\left( x-1 \right)$
The graph of ${{\log }_{2}}x$ will be same shape as graph of $\ln x$ we can write ${{\log }_{2}}x=\dfrac{\ln x}{\ln 2}$
So let’s draw the graph of ${{\log }_{2}}x$ and shift the graph 1 unit towards right
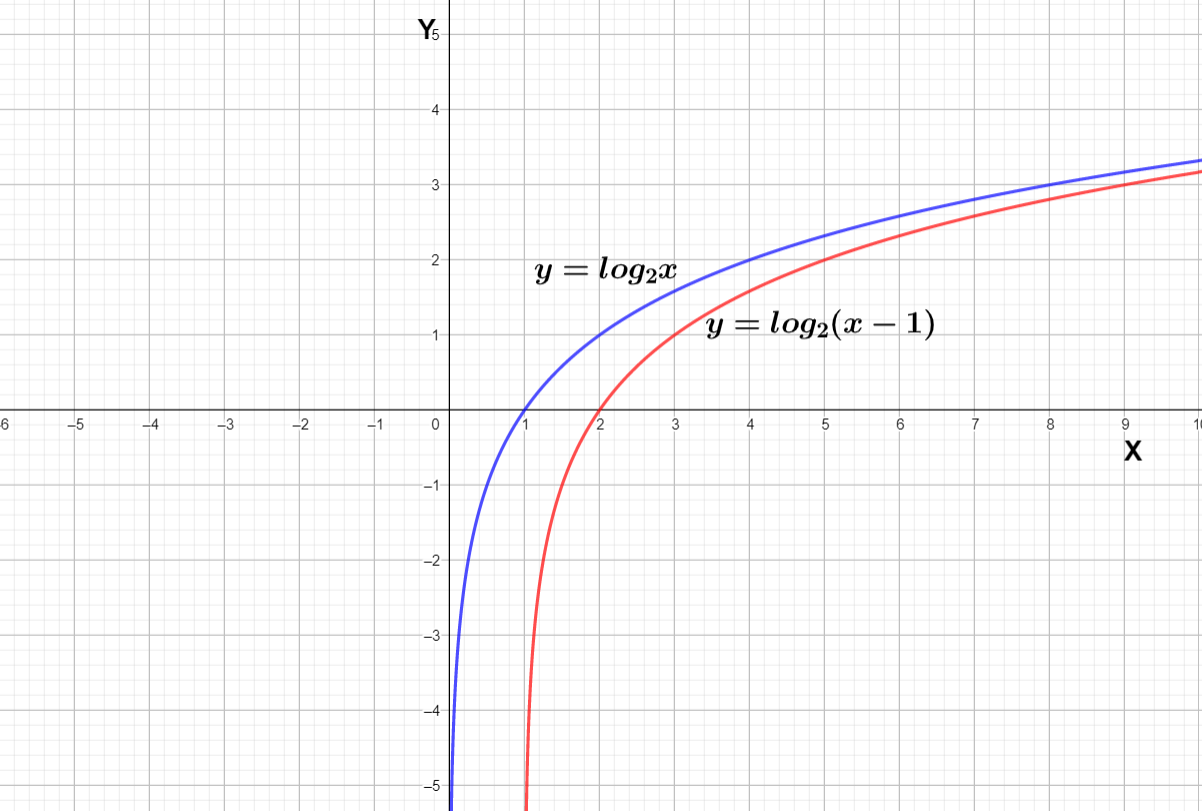
We can see the blue curve is the graph of ${{\log }_{2}}x$ shifting the curve we get the red curve which is of $y={{\log }_{2}}\left( x-1 \right)$
Note: We can see the graph of ${{\log }_{2}}x$ does not exist when x is less equal to 0 that is because the domain of log x includes only positive real numbers . The domain of $y={{\log }_{2}}\left( x-1 \right)$ is from 1 to infinity which does not include 1 because in $y={{\log }_{2}}\left( x-1 \right)$ the value of x – 1 should be positive real number and if we solve x – 1 > 0 we will get the solution $x\in \left( 1,\infty \right)$
Complete step-by-step answer:
We have to sketch $y={{\log }_{2}}\left( x-1 \right)$
We can draw the graph of ${{\log }_{2}}x$ then we will shift the graph of 1 unit towards the right. We will get the graph of $y={{\log }_{2}}\left( x-1 \right)$
The graph of ${{\log }_{2}}x$ will be same shape as graph of $\ln x$ we can write ${{\log }_{2}}x=\dfrac{\ln x}{\ln 2}$
So let’s draw the graph of ${{\log }_{2}}x$ and shift the graph 1 unit towards right
We can see the blue curve is the graph of ${{\log }_{2}}x$ shifting the curve we get the red curve which is of $y={{\log }_{2}}\left( x-1 \right)$
Note: We can see the graph of ${{\log }_{2}}x$ does not exist when x is less equal to 0 that is because the domain of log x includes only positive real numbers . The domain of $y={{\log }_{2}}\left( x-1 \right)$ is from 1 to infinity which does not include 1 because in $y={{\log }_{2}}\left( x-1 \right)$ the value of x – 1 should be positive real number and if we solve x – 1 > 0 we will get the solution $x\in \left( 1,\infty \right)$
Recently Updated Pages
Basicity of sulphurous acid and sulphuric acid are
Master Class 11 English: Engaging Questions & Answers for Success
Master Class 11 Physics: Engaging Questions & Answers for Success
Master Class 11 Computer Science: Engaging Questions & Answers for Success
Master Class 11 Chemistry: Engaging Questions & Answers for Success
Master Class 11 Social Science: Engaging Questions & Answers for Success
Trending doubts
Difference Between Prokaryotic Cells and Eukaryotic Cells
Two of the body parts which do not appear in MRI are class 11 biology CBSE
One Metric ton is equal to kg A 10000 B 1000 C 100 class 11 physics CBSE
10 examples of friction in our daily life
Draw a diagram of nephron and explain its structur class 11 biology CBSE
What will happen if the mucus is not secreted by the class 11 biology CBSE