


How do you sketch the graph of $0=-5y+9x+25$?
Answer
550.5k+ views
Hint: Now to draw the graph of the line first arrange the terms of the equation and write the equation as y in terms of x. Now substitute different values of x and find the corresponding values of y. Hence we get the points (x, y) on the line. Now plot the points and draw a line passing through the points.
Complete step by step solution:
Now we are given with a linear equation in two variables.
Now we know that a linear equation in two variables represents a straight line in the XY plane.
To plot the line we must plot some points on the line.
Now first consider the equation $0=-5y+9x+25$
Now transposing 5y on LHS we get, $5y=9x+25$
Now let us divide the whole equation by 5. Hence we get,
$\Rightarrow y=\dfrac{9}{5}x+5$
Now we have represented y in terms of x.
Hence we will substitute different values of x in the equation and find corresponding values of y.
Now substituting x = 5 in the equation we get,
$\begin{align}
& \Rightarrow y=\dfrac{9}{5}\left( 5 \right)+5 \\
& \Rightarrow y=9+5 \\
& \Rightarrow y=14 \\
\end{align}$
Now substituting x = - 5 in the equation we get,
$\begin{align}
& \Rightarrow y=\dfrac{9}{5}\left( -5 \right)+5 \\
& \Rightarrow y=5-9 \\
& \Rightarrow y=-4 \\
\end{align}$
Now again substituting x = 0 in the equation we get y = - 4.
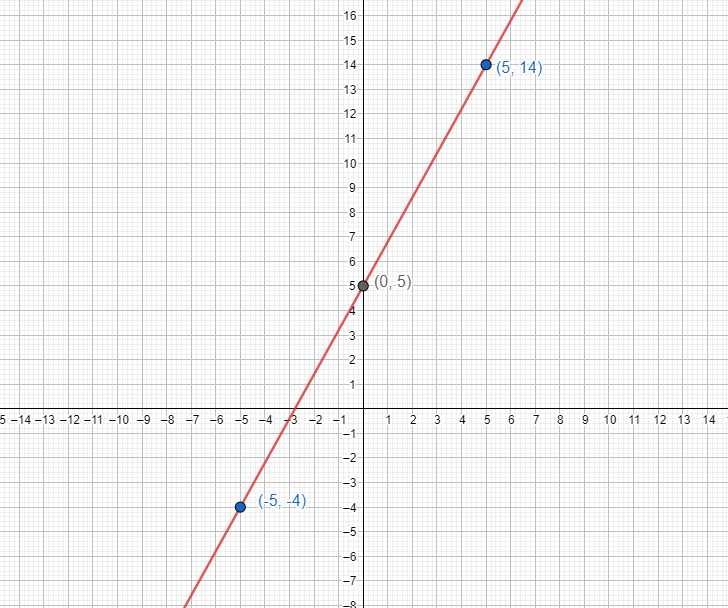
Hence we get, (5, 14), (-5, -4), (0, -4).
Now we have three points which lie on the graph of the equation.
Note: Now we know that only one line can pass through two points. Hence to draw the graph of the line represented by the equation we just need two points. Hence we need to plot a minimum of two points on the graph to draw the required line.
Complete step by step solution:
Now we are given with a linear equation in two variables.
Now we know that a linear equation in two variables represents a straight line in the XY plane.
To plot the line we must plot some points on the line.
Now first consider the equation $0=-5y+9x+25$
Now transposing 5y on LHS we get, $5y=9x+25$
Now let us divide the whole equation by 5. Hence we get,
$\Rightarrow y=\dfrac{9}{5}x+5$
Now we have represented y in terms of x.
Hence we will substitute different values of x in the equation and find corresponding values of y.
Now substituting x = 5 in the equation we get,
$\begin{align}
& \Rightarrow y=\dfrac{9}{5}\left( 5 \right)+5 \\
& \Rightarrow y=9+5 \\
& \Rightarrow y=14 \\
\end{align}$
Now substituting x = - 5 in the equation we get,
$\begin{align}
& \Rightarrow y=\dfrac{9}{5}\left( -5 \right)+5 \\
& \Rightarrow y=5-9 \\
& \Rightarrow y=-4 \\
\end{align}$
Now again substituting x = 0 in the equation we get y = - 4.
Hence we get, (5, 14), (-5, -4), (0, -4).
Now we have three points which lie on the graph of the equation.
Note: Now we know that only one line can pass through two points. Hence to draw the graph of the line represented by the equation we just need two points. Hence we need to plot a minimum of two points on the graph to draw the required line.

Recently Updated Pages
Master Class 9 General Knowledge: Engaging Questions & Answers for Success
Master Class 9 Social Science: Engaging Questions & Answers for Success
Master Class 9 English: Engaging Questions & Answers for Success
Master Class 9 Maths: Engaging Questions & Answers for Success
Master Class 9 Science: Engaging Questions & Answers for Success
Class 9 Question and Answer - Your Ultimate Solutions Guide
Trending doubts
Difference Between Plant Cell and Animal Cell
Fill the blanks with the suitable prepositions 1 The class 9 english CBSE
Who is eligible for RTE class 9 social science CBSE
Which places in India experience sunrise first and class 9 social science CBSE
What is pollution? How many types of pollution? Define it
Name 10 Living and Non living things class 9 biology CBSE