


Sketch the graph for \[y = {\cos ^{ - 1}}\left( {\cos x} \right)\]
Answer
597k+ views
Hint:
Here we need to draw the given inverse trigonometric function. For that, we will use the periodicity of inverse trigonometric functions. Then we will find the value of the given function by putting the random values of the variable. Also, the pattern graph of this function will repeat after a certain period and that period is known as the periodicity of the function.
Complete step by step solution:
Here we need to sketch the graph of the function \[y = {\cos ^{ - 1}}\left( {\cos x} \right)\].
We know the period of the given inverse trigonometric function is equal to \[2\pi \].
Therefore, to draw this graph we should draw the graph for one interval of length \[2\pi \] and we will repeat the same for entire values of \[x\] of length \[2\pi \].
We know that the value of the given function i.e. \[y = {\cos ^{ - 1}}\left( {\cos x} \right)\] is equal to \[x\] when \[0 < x < \pi \] i.e. \[y = {\cos ^{ - 1}}\left( {\cos x} \right) = x\] when \[0 < x < \pi \].
We also know that the value of the given function i.e. \[y = {\cos ^{ - 1}}\left( {\cos x} \right)\] is equal to \[2\pi - x\] when \[\pi < x < 2\pi \] i.e. \[y = {\cos ^{ - 1}}\left( {\cos x} \right) = 2\pi - x\] when \[\pi < x < 2\pi \]
Thus, it has been defined for \[0 < x < 2\pi \] that has length of \[2\pi \] . So, its graph could be plotted as:
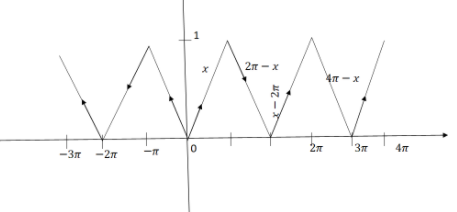
This is the required sketch of the graph for the given function \[y = {\cos ^{ - 1}}\left( {\cos x} \right)\].
Note:
We have seen that the periodicity of the given function is \[2\pi \]. If the value of the function repeats after a constant period, then we say that the given function is a periodic function. Since the periodicity of the given function is \[2\pi \], so it is repeating its values after the interval of \[2\pi \]. In trigonometry, we define the period of trigonometric functions as the distance between the repetitions of any function.
Here we need to draw the given inverse trigonometric function. For that, we will use the periodicity of inverse trigonometric functions. Then we will find the value of the given function by putting the random values of the variable. Also, the pattern graph of this function will repeat after a certain period and that period is known as the periodicity of the function.
Complete step by step solution:
Here we need to sketch the graph of the function \[y = {\cos ^{ - 1}}\left( {\cos x} \right)\].
We know the period of the given inverse trigonometric function is equal to \[2\pi \].
Therefore, to draw this graph we should draw the graph for one interval of length \[2\pi \] and we will repeat the same for entire values of \[x\] of length \[2\pi \].
We know that the value of the given function i.e. \[y = {\cos ^{ - 1}}\left( {\cos x} \right)\] is equal to \[x\] when \[0 < x < \pi \] i.e. \[y = {\cos ^{ - 1}}\left( {\cos x} \right) = x\] when \[0 < x < \pi \].
We also know that the value of the given function i.e. \[y = {\cos ^{ - 1}}\left( {\cos x} \right)\] is equal to \[2\pi - x\] when \[\pi < x < 2\pi \] i.e. \[y = {\cos ^{ - 1}}\left( {\cos x} \right) = 2\pi - x\] when \[\pi < x < 2\pi \]
Thus, it has been defined for \[0 < x < 2\pi \] that has length of \[2\pi \] . So, its graph could be plotted as:
This is the required sketch of the graph for the given function \[y = {\cos ^{ - 1}}\left( {\cos x} \right)\].
Note:
We have seen that the periodicity of the given function is \[2\pi \]. If the value of the function repeats after a constant period, then we say that the given function is a periodic function. Since the periodicity of the given function is \[2\pi \], so it is repeating its values after the interval of \[2\pi \]. In trigonometry, we define the period of trigonometric functions as the distance between the repetitions of any function.
Recently Updated Pages
Master Class 11 Social Science: Engaging Questions & Answers for Success
Master Class 11 Chemistry: Engaging Questions & Answers for Success
Master Class 12 Business Studies: Engaging Questions & Answers for Success
Master Class 12 Chemistry: Engaging Questions & Answers for Success
Master Class 12 Biology: Engaging Questions & Answers for Success
Class 12 Question and Answer - Your Ultimate Solutions Guide
Trending doubts
One Metric ton is equal to kg A 10000 B 1000 C 100 class 11 physics CBSE
Difference Between Prokaryotic Cells and Eukaryotic Cells
How many of the following diseases can be studied with class 11 biology CBSE
Two of the body parts which do not appear in MRI are class 11 biology CBSE
Which of the following enzymes is used for carboxylation class 11 biology CBSE
Explain zero factorial class 11 maths CBSE