


How do you sketch one cycle of \[y = - \cot (x)?\]
Answer
556.5k+ views
Hint: In the given question we have to find the graph of the given function \[y = - \cot (x)\] . Now first of all you should know how to plot the graph of \[\cot (x)\] . Now once you plot the graph of \[\cot (x)\] you just have to make a mirror image of it. Now in the question you have been asked to find only one cycle so just plot the one cycle of \[\cot (x)\] and make a mirror image of it you will get the graph of \[y = - \cot (x)\] .
Complete step-by-step answer:
In the given question we have to plot one cycle of \[y = - \cot (x)\] i.e.
\[y = - \cot (x) = - \dfrac{{\cos x}}{{\sin x}},\]
\[x\] is not equal to ( asymptotic ) zeroes of the denominator so,
\[k\pi ,k = 0, \pm 1, \pm 2, \pm 3,....\]
Now here period is equal to period of reciprocal \[( - \tan x) = \pi \] .
So the space between consecutive asymptotes will be \[,x = k\pi \] .
And the amplitude will be \[\dfrac{1}{2}\pi \]
Now the graph will be,
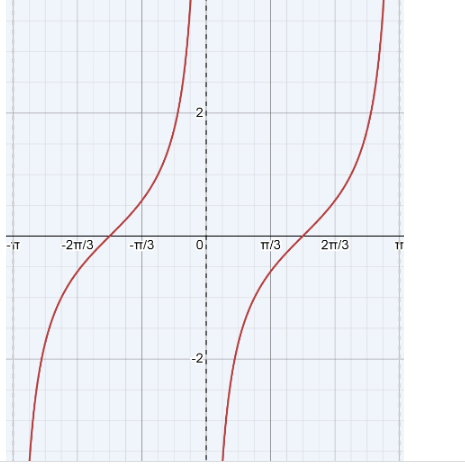
Here the horizontal line represents the x axis and the vertical line represents the y axis. now we will see how the graph was plotted,
\[x = - \arctan (\dfrac{1}{y}),x \in \left[ { - \dfrac{\pi }{2},\dfrac{\pi }{2}} \right] ,\]
Graph \[\{ x + \arctan (\dfrac{1}{y}) = 0\} \]
This phenomenon is attributed to the constraint on the range of arctan values as
\[\left[ { - \dfrac{\pi }{2},\dfrac{\pi }{2}} \right] \] .
Note: Here if you don’t know the meaning of words like asymptotic, amplitude, arctan, period so first of all you should learn all the basic terms of trigonometry as well as of functions graph. Also you should know the graph of basic functions of trigonometry because if you would have known the graph of \[\cot (x)\] you would have easily plotted the graph of \[y = - \cot (x)\] so lean all the graphs of basic trigonometry functions.
Complete step-by-step answer:
In the given question we have to plot one cycle of \[y = - \cot (x)\] i.e.
\[y = - \cot (x) = - \dfrac{{\cos x}}{{\sin x}},\]
\[x\] is not equal to ( asymptotic ) zeroes of the denominator so,
\[k\pi ,k = 0, \pm 1, \pm 2, \pm 3,....\]
Now here period is equal to period of reciprocal \[( - \tan x) = \pi \] .
So the space between consecutive asymptotes will be \[,x = k\pi \] .
And the amplitude will be \[\dfrac{1}{2}\pi \]
Now the graph will be,
Here the horizontal line represents the x axis and the vertical line represents the y axis. now we will see how the graph was plotted,
\[x = - \arctan (\dfrac{1}{y}),x \in \left[ { - \dfrac{\pi }{2},\dfrac{\pi }{2}} \right] ,\]
Graph \[\{ x + \arctan (\dfrac{1}{y}) = 0\} \]
This phenomenon is attributed to the constraint on the range of arctan values as
\[\left[ { - \dfrac{\pi }{2},\dfrac{\pi }{2}} \right] \] .
Note: Here if you don’t know the meaning of words like asymptotic, amplitude, arctan, period so first of all you should learn all the basic terms of trigonometry as well as of functions graph. Also you should know the graph of basic functions of trigonometry because if you would have known the graph of \[\cot (x)\] you would have easily plotted the graph of \[y = - \cot (x)\] so lean all the graphs of basic trigonometry functions.
Recently Updated Pages
Master Class 11 English: Engaging Questions & Answers for Success
Master Class 11 Maths: Engaging Questions & Answers for Success
Class 11 Question and Answer - Your Ultimate Solutions Guide
Master Class 11 Biology: Engaging Questions & Answers for Success
Master Class 11 Physics: Engaging Questions & Answers for Success
Master Class 11 Accountancy: Engaging Questions & Answers for Success
Trending doubts
Differentiate between an exothermic and an endothermic class 11 chemistry CBSE
One Metric ton is equal to kg A 10000 B 1000 C 100 class 11 physics CBSE
There are 720 permutations of the digits 1 2 3 4 5 class 11 maths CBSE
In what year Guru Nanak Dev ji was born A15 April 1469 class 11 social science CBSE
Difference Between Prokaryotic Cells and Eukaryotic Cells
Draw a diagram of a plant cell and label at least eight class 11 biology CBSE