


Show the following information by a percentage bar graph
Division of standard A B C D Number of studentsSecuring grade A 45 33 10 15 Total Number of Students 60 55 40 75
| Division of standard | A | B | C | D |
| Number of studentsSecuring grade A | 45 | 33 | 10 | 15 |
| Total Number of Students | 60 | 55 | 40 | 75 |
Answer
516.6k+ views
Hint: We will first find out the percentage of each standard who secured the grade A as given in the table, with respect to the total number of students in particular standard. Then we will place the data to make a percentage bar graph.
Complete step-by-step solution:
Moving ahead with the question in step wise method to find out the percentage of each standard who secured grade A with respect to all students in respective standards. So according to the percentage theorem we know that $\dfrac{a}{b}\times 100$ which is equal to the percentage of a with respect to b.
So percentage for standard A is equal to students who secured grade A with respect to total number of students in standard A is equal to $=\dfrac{45}{60}\times 100=75\%$
Similarly percentage for standard B is $=\dfrac{33}{55}\times 100=60\%$
Same percentage for standard C will be $=\dfrac{10}{40}\times 100=25\%$
And for standard D will be $=\dfrac{15}{75}\times 100=20\%$
Now we will make table for this percentage, so we will get;
Now place the data, to find out the percentage bar i.e.
Note: Percentage bar is used to compare the data, as in our case to compare the number of students who got grade A compared to total number of students. We can also relate it as remaining students secured other grades which can be B, C, and so on.
Complete step-by-step solution:
Moving ahead with the question in step wise method to find out the percentage of each standard who secured grade A with respect to all students in respective standards. So according to the percentage theorem we know that $\dfrac{a}{b}\times 100$ which is equal to the percentage of a with respect to b.
So percentage for standard A is equal to students who secured grade A with respect to total number of students in standard A is equal to $=\dfrac{45}{60}\times 100=75\%$
Similarly percentage for standard B is $=\dfrac{33}{55}\times 100=60\%$
Same percentage for standard C will be $=\dfrac{10}{40}\times 100=25\%$
And for standard D will be $=\dfrac{15}{75}\times 100=20\%$
Now we will make table for this percentage, so we will get;
| Division of standard | A | B | C | D |
| Number of studentsSecuring grade A | 45 | 33 | 10 | 15 |
| Total Number of Students | 60 | 55 | 40 | 75 |
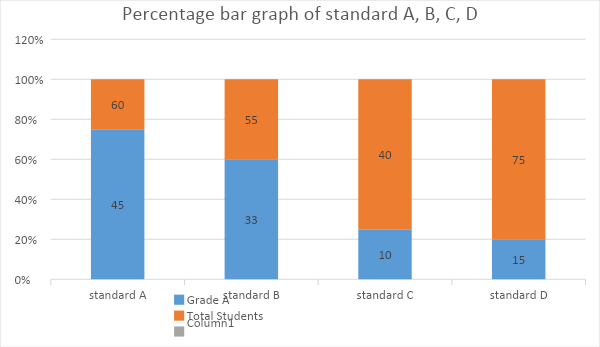
| percentage | $75\%$ | $60\%$ | $25\%$ | $20\%$ |
Now place the data, to find out the percentage bar i.e.
Note: Percentage bar is used to compare the data, as in our case to compare the number of students who got grade A compared to total number of students. We can also relate it as remaining students secured other grades which can be B, C, and so on.
Recently Updated Pages
Master Class 8 Social Science: Engaging Questions & Answers for Success
Master Class 8 English: Engaging Questions & Answers for Success
Class 8 Question and Answer - Your Ultimate Solutions Guide
Master Class 8 Maths: Engaging Questions & Answers for Success
Master Class 8 Science: Engaging Questions & Answers for Success
Master Class 9 General Knowledge: Engaging Questions & Answers for Success
Trending doubts
What are the 12 elements of nature class 8 chemistry CBSE
What is the difference between rai and mustard see class 8 biology CBSE
When people say No pun intended what does that mea class 8 english CBSE
Write a short biography of Dr APJ Abdul Kalam under class 8 english CBSE
Write a letter to the Municipal Commissioner to inform class 8 english CBSE
Compare the manure and fertilizer in maintaining the class 8 biology CBSE