


What is the shape of this Histogram?
A. Symmetrical
B. Skewed left
C. Skewed right
D. Rotational
Answer
469.2k+ views
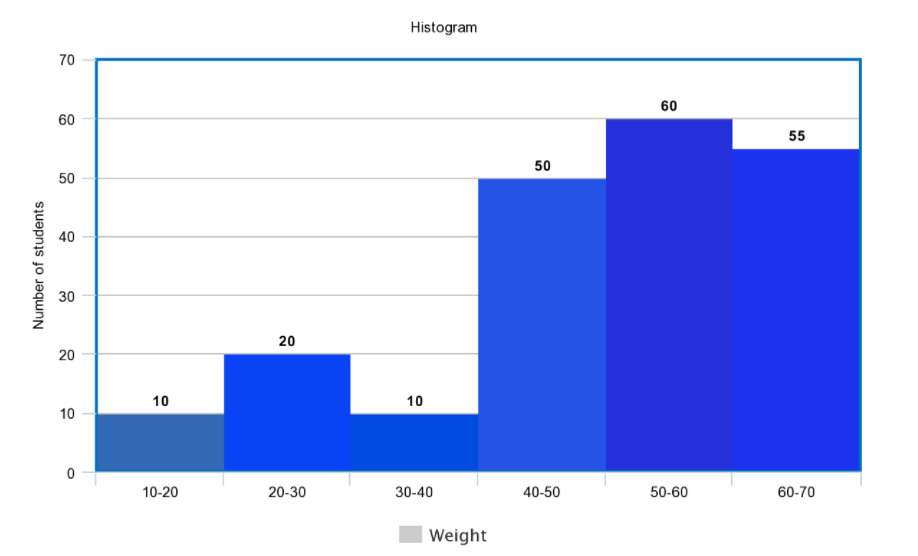
Hint: In the above given question, we are given a histogram representing the weights of a number of students between the weights from 10 to 70 (in kg). We have to determine the shape of the given histogram. In order to approach the solution, we have to consider the different types of possible shapes of a histogram to check if the given histogram matches with what kind of shape of a histogram. A histogram generally can have 8 types of distributions i.e. shapes.
Complete answer:
We are given a histogram of different numbers of students having different weights.We have to determine the correct shape of the given histogram from the four different given options.To determine the correct shape of the given histogram, we can check each option and see if they explain the same kind of histogram that is given above.
A. Symmetrical
A histogram distribution is symmetrical if a vertical line can be drawn at some point in the histogram such that the shape to the left and the right of the vertical line are mirror images of each other. However, such a case is not applicable here, so it is the incorrect option.
B. Skewed left
A skewed left histogram distribution is the one in which the tail of the distribution is lying on the left side. That means, the majority of the higher distributions are located at the left side of the histogram.But this is not the case here, so it is the incorrect option.
C. Skewed right
Similarly as the above case, a skewed right histogram distribution is the one in which the tail of the distribution is lying on the right side. That means, the majority of the higher distributions are located at the right side of the histogram.This distribution is clearly suitable for the above given histogram.Hence, it is the correct option.
D. Rotational
The above given histogram is not rotational as it is a skewed right histogram. Hence it is the incorrect option.Therefore, the shape of this histogram is skewed right.
Hence the correct option is C.
Note: There are different shapes of a histogram distribution which depend on their used data. The shapes are determined by noticing the peaks of the distribution. There can be at least one or more peaks in a histogram distribution. Some most commonly used histogram distributions are normal, peaked, double-peaked or bimodal, plateau or multimodal, edge peak and comb distributions.
Recently Updated Pages
Master Class 11 Computer Science: Engaging Questions & Answers for Success
Master Class 11 Business Studies: Engaging Questions & Answers for Success
Master Class 11 Economics: Engaging Questions & Answers for Success
Master Class 11 English: Engaging Questions & Answers for Success
Master Class 11 Maths: Engaging Questions & Answers for Success
Master Class 11 Biology: Engaging Questions & Answers for Success
Trending doubts
One Metric ton is equal to kg A 10000 B 1000 C 100 class 11 physics CBSE
There are 720 permutations of the digits 1 2 3 4 5 class 11 maths CBSE
Discuss the various forms of bacteria class 11 biology CBSE
Draw a diagram of a plant cell and label at least eight class 11 biology CBSE
State the laws of reflection of light
Explain zero factorial class 11 maths CBSE