


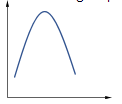
Select the right option regarding the graph
A. x-axis – rate of reaction
y-axis – enzymatic activity
B. x-axis – enzymatic activity
y-axis – rate of reaction
C. x-axis – enzymatic activity
y-axis – pH/temperature
D. x-axis – pH/temperature
y-axis – enzymatic activity
Answer
576.3k+ views
Hint: There is a relationship between all the variables and the option, analyze those relations. Enzymatic activity increase is considered good for the reaction and also enzymes have a range of temperature in which it can work.
Complete answer:
We have a clear idea that enzymatic activity of a reaction is due to the working of enzymes in speeding up the pace of reaction. But the speed of the reaction can be increased only when the substrate is there, if substrate is all consumed up then the reaction will eventually stop because the enzymes work by binding with the substrate molecule and eventually giving us the product.
Now if we consider that the substrate which is provided to us and the enzymes present are infinite then we can say that along with the increase in the enzymatic activity the rate of reaction will also increase because the reaction is taking place with the substrate so we will get a directly proportional linear graph and if somehow the availability of substrate stops the automatically the rate of reaction will drop gradually coming to the zero level. It will not follow a curve graph because the rate will become zero and in the graph the line does not touch the x axis line.
Now considering the relation between the temperature and enzymatic activity, we know that enzymes work under specific temperature range and below and above this range the enzyme will not work. So if we have to plot a graph between the two we will see an increase in the activity with the increase in temperature and the activity will be at peak on a certain temperature best suited for the enzyme and after that with the increase in temperature the enzyme will slowly degenerate and activity will decrease slowly.
So, the correct answer is option D.
Note: The variable with which we have to find the relation should always have to be on the y axis and the variable which does not show variation and will always increase will be on the x-axis.
Recently Updated Pages
Master Class 12 Economics: Engaging Questions & Answers for Success
Master Class 12 Physics: Engaging Questions & Answers for Success
Master Class 12 English: Engaging Questions & Answers for Success
Master Class 12 Social Science: Engaging Questions & Answers for Success
Master Class 12 Maths: Engaging Questions & Answers for Success
Master Class 12 Business Studies: Engaging Questions & Answers for Success
Trending doubts
Which are the Top 10 Largest Countries of the World?
What are the major means of transport Explain each class 12 social science CBSE
Draw a labelled sketch of the human eye class 12 physics CBSE
Differentiate between insitu conservation and exsitu class 12 biology CBSE
Draw a neat and well labeled diagram of TS of ovary class 12 biology CBSE
Give 10 examples of unisexual and bisexual flowers