


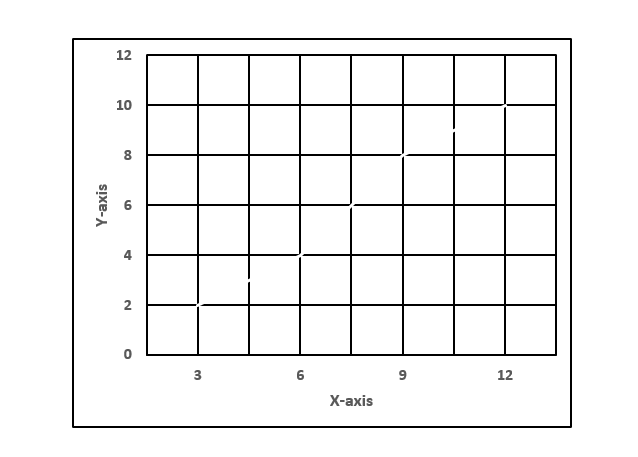
What is the scale used for the graph?
A.x-axis 3:1, y-axis 2:1
B.x-axis 1:3, y-axis 1:2
C.x-axis 1:1, y-axis 1:4
D.x-axis 2:3, y-axis 1:2
Answer
612.9k+ views
Hint: Most often, when we use a graph, each mark on the axis represents one unit. However, sometimes, if we have values that are large numbers, we may need to scale the axes differently. The scale is defined as the numbers corresponding to the units used on the graph.
In simple words, a scale is interpreted as a set of numbers that help to measure or quantify objects. A scale on the graph represents the way the numbers are given in data.
Complete step-by-step answer:
The distance between two numbers on any axis indicates a unit and this unit remains uniform throughout a scale for that axis. Thus, a scale plays a very important part in plotting graphs. Without scales, it will become very difficult to infer anything relevant from the graph.
In the graph given in the question, the scale on x-axis is 3 units per block of the x -axis and scale of y-axis is 2 units per block of y-axis.
Then, x−axis 1:3 and y−axis 1:2.
Therefore, option (B) is the correct answer.
Note: The scale selected for a graph axis has an impact on how we interpret the message and is an important part of optimising data visualisation. Please be very careful if the scales are different on the two axes.
Common constraints faced when choosing graph scales
i.The range of the values on each scale to include the range of all the data to be plotted.
ii.The need for a particular value (such as zero) to be included in a scale
iii.The need for the graph to appropriately show the key trends in the data.

Recently Updated Pages
Master Class 12 Economics: Engaging Questions & Answers for Success
Master Class 12 English: Engaging Questions & Answers for Success
Master Class 12 Social Science: Engaging Questions & Answers for Success
Master Class 12 Maths: Engaging Questions & Answers for Success
Master Class 12 Physics: Engaging Questions & Answers for Success
Master Class 7 Science: Engaging Questions & Answers for Success
Trending doubts
How many crores make 10 million class 7 maths CBSE
The HCF of 24721284 and a third number N is 12 If their class 7 maths CBSE
Full Form of IASDMIPSIFSIRSPOLICE class 7 social science CBSE
List of coprime numbers from 1 to 100 class 7 maths CBSE
Write a short note on the great bath of MohenjoDar class 7 social science CBSE
The plural of Chief is Chieves A True B False class 7 english CBSE