


Represent the following data by a pie diagram:
Items of expenditure Expenditure Family A Family B Food 4000 6400 Clothing 2500 480 Rent 1500 3200 Education 400 1000 Miscellaneous 1600 600 Total 10000 11680
| Items of expenditure | Expenditure | |
| Family A | Family B | |
| Food | 4000 | 6400 |
| Clothing | 2500 | 480 |
| Rent | 1500 | 3200 |
| Education | 400 | 1000 |
| Miscellaneous | 1600 | 600 |
| Total | 10000 | 11680 |
Answer
616.8k+ views
Hint: In this question, we are given data on expenditure for two families and we have to draw a pie chart for both of them. For this, we will first change the expenditure of different items into central angles (degrees) for a circle using the formula:
\[\text{Central angle of component}=\dfrac{\text{Component Value}}{\text{Sum of all components}}\times 360\]
After that, we will make a pie chart using these degrees for both families.
Complete step-by-step solution:
Let us first change the expenditure for different items of both families into central angles. We will do it using the formula:
\[\text{Central angle of component}=\dfrac{\text{Component Value}}{\text{Sum of all components}}\times 360\]
Let us draw a table for both families and find degrees in the table.
Here, the sum of all components is 10000 for family A and 11680 for family B.
Now, let us understand the steps involved in making pie charts.
Step 1: Draw a circle of an appropriate radius.
Step 2: Draw a vertical radius of the circle drawn in step 1.
Step 3: Choose the largest central angle. Here, the largest central angle for family A is ${{144}^{\circ }}$. So, for family, A draw a sector with central angle ${{144}^{\circ }}$ in such a way that one of its radii coincide with the radius drawn in step 2 and another radius is in its counter-clockwise direction. Similarly, family B starts with ${{197.3}^{\circ }}$.
Step 4: Construct other sectors representing other items in the clockwise sense in descending order of magnitude of their central angles.
Step 5: Shade the sectors with different patterns and label them.
Now, let us draw pie charts for both families using the above steps.

Note: Students should carefully convert given data into central angles (degrees) to make pie charts. While drawing the last sector the radius should coincide with the first drawn radius. Make sure that the sum of all degrees becomes equal to ${{360}^{\circ }}$.
\[\text{Central angle of component}=\dfrac{\text{Component Value}}{\text{Sum of all components}}\times 360\]
After that, we will make a pie chart using these degrees for both families.
Complete step-by-step solution:
Let us first change the expenditure for different items of both families into central angles. We will do it using the formula:
\[\text{Central angle of component}=\dfrac{\text{Component Value}}{\text{Sum of all components}}\times 360\]
Let us draw a table for both families and find degrees in the table.
Here, the sum of all components is 10000 for family A and 11680 for family B.
| Items of expenditure | Family A | Family B | ||
| Expenditure | Sector angle | Expenditure | Sector angle | |
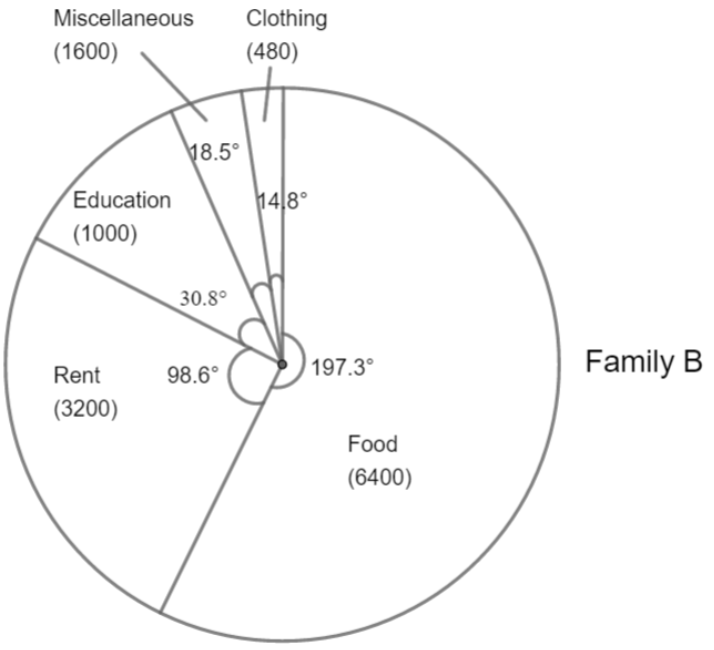
| Food | 4000 | $\dfrac{4000}{10000}\times 360=144$ | 6400 | $\dfrac{6400}{11680}\times 360=197.3$ |
| Clothing | 2500 | $\dfrac{2500}{10000}\times 360=90$ | 480 | $\dfrac{480}{11680}\times 360=14.8$ |
| Rent | 1500 | $\dfrac{1500}{10000}\times 360=54$ | 3200 | $\dfrac{3200}{11680}\times 360=98.6$ |
| Education | 400 | $\dfrac{1600}{10000}\times 360=57.6$ | 1000 | $\dfrac{600}{11680}\times 360=18.5$ |
| Miscellaneous | 1600 | $\dfrac{400}{10000}\times 360=14.4$ | 600 | $\dfrac{1000}{11680}\times 360=30.8$ |
Now, let us understand the steps involved in making pie charts.
Step 1: Draw a circle of an appropriate radius.
Step 2: Draw a vertical radius of the circle drawn in step 1.
Step 3: Choose the largest central angle. Here, the largest central angle for family A is ${{144}^{\circ }}$. So, for family, A draw a sector with central angle ${{144}^{\circ }}$ in such a way that one of its radii coincide with the radius drawn in step 2 and another radius is in its counter-clockwise direction. Similarly, family B starts with ${{197.3}^{\circ }}$.
Step 4: Construct other sectors representing other items in the clockwise sense in descending order of magnitude of their central angles.
Step 5: Shade the sectors with different patterns and label them.
Now, let us draw pie charts for both families using the above steps.
Note: Students should carefully convert given data into central angles (degrees) to make pie charts. While drawing the last sector the radius should coincide with the first drawn radius. Make sure that the sum of all degrees becomes equal to ${{360}^{\circ }}$.
Recently Updated Pages
Master Class 11 English: Engaging Questions & Answers for Success
Master Class 11 Social Science: Engaging Questions & Answers for Success
Master Class 11 Maths: Engaging Questions & Answers for Success
Master Class 11 Biology: Engaging Questions & Answers for Success
Master Class 11 Physics: Engaging Questions & Answers for Success
Master Class 11 Chemistry: Engaging Questions & Answers for Success
Trending doubts
Explain the Treaty of Vienna of 1815 class 10 social science CBSE
What is the full form of POSCO class 10 social science CBSE
Define Potential, Developed, Stock and Reserved resources
The diagonals of a rhombus are 10cm and 24cm Find the class 10 maths CBSE
Fill the blanks with proper collective nouns 1 A of class 10 english CBSE
What planets have no moons Which one has only one moon class 10 physics CBSE