


How can I represent an exothermic reaction in a potential energy diagram?
Answer
584.7k+ views
Hint: The potential energy diagram represents the change in the potential energy of the system when the reactant is converted to product. In an exothermic reaction, the heat is released by the system. The change in enthalpy is less than zero.
Complete step by step answer:
The exothermic reaction is defined as the reaction where the energy is released by the system. The enthalpy change of exothermic reaction is less than zero. $\Delta H < 0$.
The example for the exothermic reaction is the combustion of glucose.
The reaction is shown below.
${C_6}{H_{12}}{O_6} + 6{O_2} \to 6C{O_2} + 6{H_2}O$
In this reaction, one mole of glucose reacts with six moles of oxygen to form six mole of carbon dioxide and six mole of water.
During the chemical reaction, the energy change takes place which is shown by the diagram known as potential energy diagram.
The potential energy diagram shows the change in the potential energy of the system when the reactant compound changes to produce.
In the potential energy diagram, in y-axis potential energy is shown and in x-axis time is shown.
The potential energy diagram for the exothermic reaction is shown below.
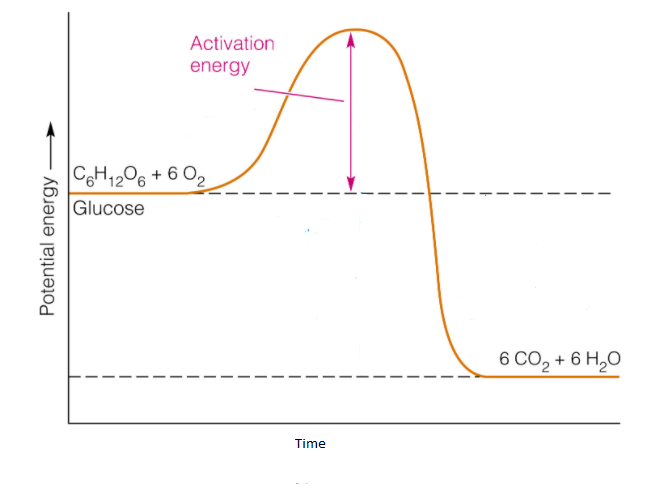
In the potential energy diagram, the potential energy of the reactant is higher than the potential energy of the product which can be seen in the diagram.
Note:
The difference in the potential energy of product and reactant is the enthalpy change.
$\Delta H = {H_f} - {H_I}$,
Where,
${H_f}$ is the enthalpy of product
${H_I}$ is the enthalpy of reactant
As, the ${H_f}$ is smaller than ${H_I}$, the enthalpy change $\Delta H$ is negative.
Complete step by step answer:
The exothermic reaction is defined as the reaction where the energy is released by the system. The enthalpy change of exothermic reaction is less than zero. $\Delta H < 0$.
The example for the exothermic reaction is the combustion of glucose.
The reaction is shown below.
${C_6}{H_{12}}{O_6} + 6{O_2} \to 6C{O_2} + 6{H_2}O$
In this reaction, one mole of glucose reacts with six moles of oxygen to form six mole of carbon dioxide and six mole of water.
During the chemical reaction, the energy change takes place which is shown by the diagram known as potential energy diagram.
The potential energy diagram shows the change in the potential energy of the system when the reactant compound changes to produce.
In the potential energy diagram, in y-axis potential energy is shown and in x-axis time is shown.
The potential energy diagram for the exothermic reaction is shown below.
In the potential energy diagram, the potential energy of the reactant is higher than the potential energy of the product which can be seen in the diagram.
Note:
The difference in the potential energy of product and reactant is the enthalpy change.
$\Delta H = {H_f} - {H_I}$,
Where,
${H_f}$ is the enthalpy of product
${H_I}$ is the enthalpy of reactant
As, the ${H_f}$ is smaller than ${H_I}$, the enthalpy change $\Delta H$ is negative.
Recently Updated Pages
Master Class 11 Social Science: Engaging Questions & Answers for Success
Master Class 11 Chemistry: Engaging Questions & Answers for Success
Master Class 12 Business Studies: Engaging Questions & Answers for Success
Master Class 12 Chemistry: Engaging Questions & Answers for Success
Master Class 12 Biology: Engaging Questions & Answers for Success
Class 12 Question and Answer - Your Ultimate Solutions Guide
Trending doubts
How many of the following diseases can be studied with class 11 biology CBSE
Which of the following enzymes is used for carboxylation class 11 biology CBSE
Explain zero factorial class 11 maths CBSE
Draw a diagram of a plant cell and label at least eight class 11 biology CBSE
Receptor sites for neurotransmitters are present on class 11 biology CBSE
JGA JuxtaGlomerular Apparatus a sensitive region which class 11 biology CBSE