


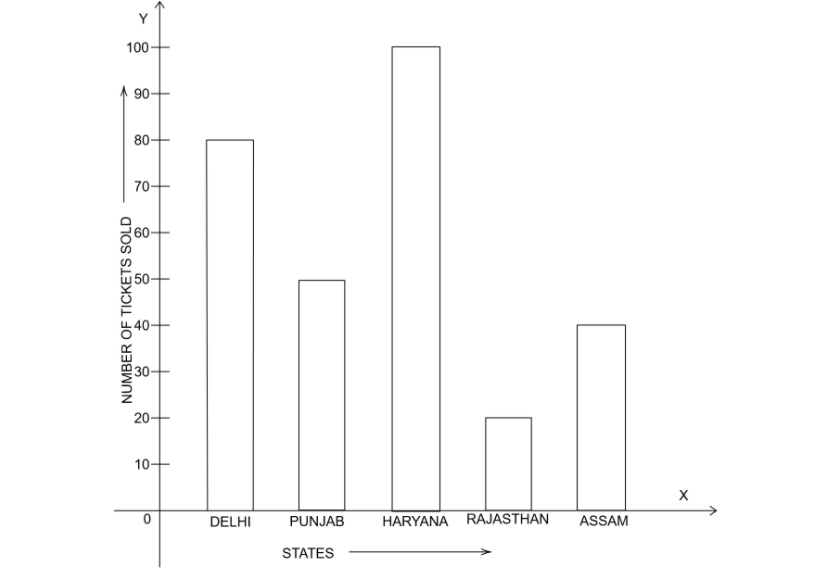
Read the bar graph and answer the following question :
Of which state were the minimum number of tickets sold ?
Answer
534.6k+ views
Hint: We have to answer the following questions . We solve this question using the concept of the study of bar graphs . Reading the graph we will answer the following questions . The data represents the number of tickets sold in different states .
Complete step-by-step answer:
A bar graph is stated as the pictorial or the graphical representation of a collection of data in the forms of bars on the graph paper .
This representation makes the study of the data more precise and more understandable for the observer .
A double bar graph is stated as the pictorial or the graphical representation of data in the form of two bars on a graph paper . This representation of the graphs is used for comparing the data of two quantities for the same intervals .
This graphical representation makes the comparison of two data’s more feasible and easy to understand or compare .
From the graph we conclude that the state of Rajasthan has sold the minimum number of tickets in the given bar graph . The number of tickets sold by the state of Rajasthan is 20 .
Hence , the state which sold the minimum number of tickets is Rajasthan .
So, the correct answer is “Rajasthan”.
Note: In the given question, we should know how to read a bar graph in order to answer the question asked in the problem. We must have an in-depth knowledge of data handling topics to face these kinds of problems.
Recently Updated Pages
Master Class 12 Economics: Engaging Questions & Answers for Success
Master Class 12 English: Engaging Questions & Answers for Success
Master Class 12 Social Science: Engaging Questions & Answers for Success
Master Class 12 Maths: Engaging Questions & Answers for Success
Master Class 12 Physics: Engaging Questions & Answers for Success
Master Class 9 General Knowledge: Engaging Questions & Answers for Success
Trending doubts
Difference Between Plant Cell and Animal Cell
Find the sum of series 1 + 2 + 3 + 4 + 5 + + 100 class 9 maths CBSE
Fill the blanks with the suitable prepositions 1 The class 9 english CBSE
What is pollution? How many types of pollution? Define it
Name 10 Living and Non living things class 9 biology CBSE
What is the full form of pH?