


What is the range of temperatures in Bangalore over 11 years mentioned in the graph below?
(a) \[{{20}^{0}}C\]
(b) \[{{10}^{0}}C\]
(c) \[{{33}^{0}}C\]
(d) \[{{45}^{0}}C\]
Answer
604.5k+ views
Hint: We solve this problem by using the simple formula of range given as the difference between the maximum temperature and minimum temperature over the 11 years given in the graph. So, the formula of range is given as
\[\text{Range}=\text{Maximum temperature}-\text{minimum temperature}\]
By using this formula we calculate the range of given data.
Complete step by step answer:
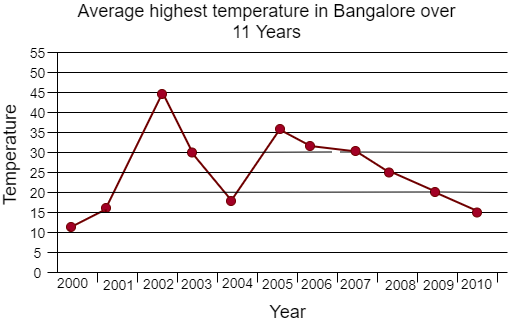
We are given the graph of change of average temperature with the respective year of Bangalore over the 11 years from 2000 – 2010.
From the graph we can clearly see that the maximum temperature is recorded in the year 2002.
So, we can say that the maximum temperature recorded in the 11 years is \[{{45}^{0}}C\] in the year 2002.
Similarly, we can see that the minimum temperature is recorded in the year 2000.
So, we can say that the minimum temperature recorded in the 11 years is \[{{12}^{0}}C\] in the year 2000.
We know that the formula of range is given simply by the difference of maximum temperature and minimum temperature that is
\[\text{Range}=\text{Maximum temperature}-\text{minimum temperature}\]
Here, we have the maximum temperature as \[{{45}^{0}}C\] and the minimum temperature as \[{{12}^{0}}C\].
By substituting the values of maximum temperature and minimum temperature in the formula we get
\[\begin{align}
& \Rightarrow \text{Range}={{45}^{0}}C-{{12}^{0}}C \\
& \Rightarrow \text{Range}={{33}^{0}}C \\
\end{align}\]
Therefore, we can say that the range of temperature in Bangalore over 11 years from 2000 – 2010 is given as \[{{33}^{0}}C\].
So, the correct answer is “Option c”.
Note: Students may make mistakes in taking the temperature values of respective years from the graph. In the graph given the value of minimum temperature is \[{{12}^{0}}C\] in the year 2000. Since, the temperature is not appropriately shown in the graph students may take any value between \[{{15}^{0}}C\]and \[{{20}^{0}}C\] which gives the wrong answer. Since, the point is near to \[{{15}^{0}}C\] taking \[{{12}^{0}}C\] is an appropriate one. Taking the temperature value from the graph is important.
\[\text{Range}=\text{Maximum temperature}-\text{minimum temperature}\]
By using this formula we calculate the range of given data.
Complete step by step answer:
We are given the graph of change of average temperature with the respective year of Bangalore over the 11 years from 2000 – 2010.
From the graph we can clearly see that the maximum temperature is recorded in the year 2002.
So, we can say that the maximum temperature recorded in the 11 years is \[{{45}^{0}}C\] in the year 2002.
Similarly, we can see that the minimum temperature is recorded in the year 2000.
So, we can say that the minimum temperature recorded in the 11 years is \[{{12}^{0}}C\] in the year 2000.
We know that the formula of range is given simply by the difference of maximum temperature and minimum temperature that is
\[\text{Range}=\text{Maximum temperature}-\text{minimum temperature}\]
Here, we have the maximum temperature as \[{{45}^{0}}C\] and the minimum temperature as \[{{12}^{0}}C\].
By substituting the values of maximum temperature and minimum temperature in the formula we get
\[\begin{align}
& \Rightarrow \text{Range}={{45}^{0}}C-{{12}^{0}}C \\
& \Rightarrow \text{Range}={{33}^{0}}C \\
\end{align}\]
Therefore, we can say that the range of temperature in Bangalore over 11 years from 2000 – 2010 is given as \[{{33}^{0}}C\].
So, the correct answer is “Option c”.
Note: Students may make mistakes in taking the temperature values of respective years from the graph. In the graph given the value of minimum temperature is \[{{12}^{0}}C\] in the year 2000. Since, the temperature is not appropriately shown in the graph students may take any value between \[{{15}^{0}}C\]and \[{{20}^{0}}C\] which gives the wrong answer. Since, the point is near to \[{{15}^{0}}C\] taking \[{{12}^{0}}C\] is an appropriate one. Taking the temperature value from the graph is important.

Recently Updated Pages
Master Class 12 Economics: Engaging Questions & Answers for Success
Master Class 12 English: Engaging Questions & Answers for Success
Master Class 12 Social Science: Engaging Questions & Answers for Success
Master Class 12 Maths: Engaging Questions & Answers for Success
Master Class 12 Physics: Engaging Questions & Answers for Success
Master Class 8 English: Engaging Questions & Answers for Success
Trending doubts
What is BLO What is the full form of BLO class 8 social science CBSE
Which Indian state shares the longest international class 8 social science CBSE
What are the 12 elements of nature class 8 chemistry CBSE
Citizens of India can vote at the age of A 18 years class 8 social science CBSE
Right to vote is a AFundamental Right BFundamental class 8 social science CBSE
Full form of STD, ISD and PCO