


How is the pressure versus volume graph for a sample of an ideal gas at constant temperature?
Answer
576.6k+ views
Hint:. The following question is based on ideal gas equation i.e. PV= nRT. Here V is volume of gas in liters (L), P is pressure in atmospheres (atm), T is temperature if gas in kelvins (K) and n is moles of gas taken (mol).
Complete step by step answer:
The question about a condition of gas where temperature is kept constant and pressure change is studied with change in volume or vice versa. To obtain the answer we will consider that the gas is an ideal one. An ideal gas is defined as a hypothetical gaseous substance whose behavior is independent of attractive and repulsive forces and can be completely described by the ideal gas law. The ideal gas law equation is PV=nRT.
Where V= Volume of gas in liters (L)
P = Pressure in atmospheres (atm)
T = Temperature if gas in kelvins (K)
n = Moles of gas taken (mol)
R = Universal gas constant.
Now R is a constant, n is also constant as the number of moles are not changing during the process and T is constant too, as said in the question. So the ideal gas equation now become:
PV= Constant
$P \propto \dfrac{1}{V}$
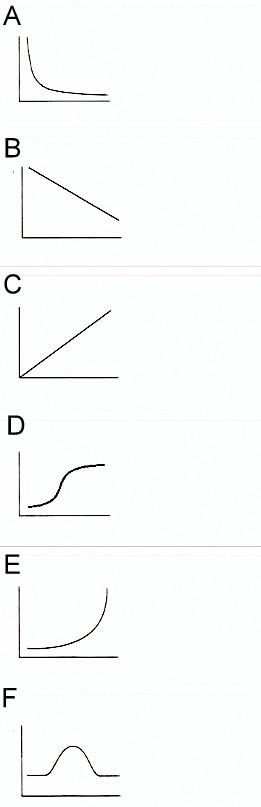
This is Boyle’s law too and the graph obtained from this relation is rectangular hyperbola.
Note: Don’t get confused with the indirectly proportional relation of P and V, as indirectly proportional variables provide straight line graphs with negative slope. Here the graph depends on the constant temperature to which it makes its rectangular hyperbola.
Complete step by step answer:
The question about a condition of gas where temperature is kept constant and pressure change is studied with change in volume or vice versa. To obtain the answer we will consider that the gas is an ideal one. An ideal gas is defined as a hypothetical gaseous substance whose behavior is independent of attractive and repulsive forces and can be completely described by the ideal gas law. The ideal gas law equation is PV=nRT.
Where V= Volume of gas in liters (L)
P = Pressure in atmospheres (atm)
T = Temperature if gas in kelvins (K)
n = Moles of gas taken (mol)
R = Universal gas constant.
Now R is a constant, n is also constant as the number of moles are not changing during the process and T is constant too, as said in the question. So the ideal gas equation now become:
PV= Constant
$P \propto \dfrac{1}{V}$
This is Boyle’s law too and the graph obtained from this relation is rectangular hyperbola.
Note: Don’t get confused with the indirectly proportional relation of P and V, as indirectly proportional variables provide straight line graphs with negative slope. Here the graph depends on the constant temperature to which it makes its rectangular hyperbola.
Recently Updated Pages
Master Class 11 Computer Science: Engaging Questions & Answers for Success
Master Class 11 Business Studies: Engaging Questions & Answers for Success
Master Class 11 Economics: Engaging Questions & Answers for Success
Master Class 11 English: Engaging Questions & Answers for Success
Master Class 11 Maths: Engaging Questions & Answers for Success
Master Class 11 Biology: Engaging Questions & Answers for Success
Trending doubts
One Metric ton is equal to kg A 10000 B 1000 C 100 class 11 physics CBSE
There are 720 permutations of the digits 1 2 3 4 5 class 11 maths CBSE
Discuss the various forms of bacteria class 11 biology CBSE
Draw a diagram of a plant cell and label at least eight class 11 biology CBSE
State the laws of reflection of light
Explain zero factorial class 11 maths CBSE