


What is the possible for \[g\left( x \right)\] in terms of \[f\left( x \right)\]?
The graph of \[g\left( x \right)\] is the graph of \[f\left( x \right)\] after it has been vertically stretched or shrunk. The point \[\left( 3,6 \right)\] lies on the graph of \[f\left( x \right)\] . The corresponding point on the graph of \[g\left( x \right)\] is \[\left( 3,12 \right)\]. What is the possible formula for \[g\left( x \right)\] in terms of \[f\left( x \right)\]?
Answer
528.9k+ views
Hint: We can observe that the point shifts up by 6 units. If \[k>1\], the graph of \[y=k\centerdot f\left( x \right)\] is the graph of \[f\left( x \right)\] vertically stretched by multiplying each of its \[y-\]coordinates by \[k\]. If \[0 < k < 1\], the graph is \[f\left( x \right)\] vertically shrunk by multiplying each of its \[y-\] coordinates by \[k\].
Complete step-by-step answer:
Now let us find out the possible formula for \[g\left( x \right)\] in terms of \[f\left( x \right)\].
Since \[f\left( x \right)\] is vertically stretched or shrunk in a graph, we have to multiply a number \[n\], which is greater than 1 if the graph is stretched else with a number less than 1 but greater than 0. This makes the graph shrink.
Contrarily, if we just add \[a\], it will either shift it up if it is positive or shift it down, if it is negative.
Since our given condition is either stretched or shrunk, we get
\[g\left( x \right)=2f\left( x \right)\]
On verifying, we find that
If \[f\left( x \right)=6\]
\[g\left( x \right)=2f\left( x \right)\]
Then, \[2\times 6=12\].
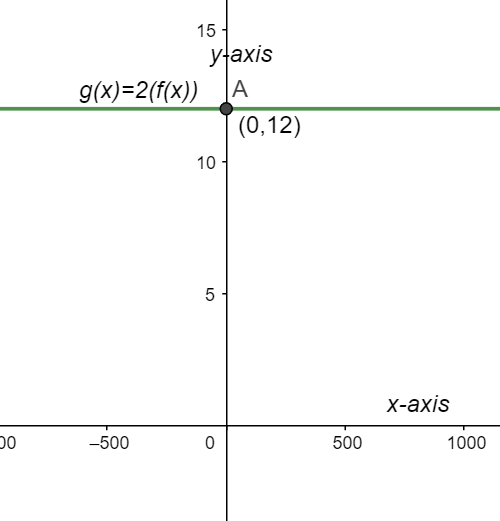
\[\therefore \] The possible formula of \[g\left( x \right)\] in terms of \[f\left( x \right)\] is \[g\left( x \right)=2f\left( x \right)\].
Note: We can notice that when the graph is stretched, we can expect that the graph’s \[y-\]coordinates to be farther from the \[x-\] axis but the input values remains same. In general, the vertical stretch equation is given by \[y=k\centerdot f\left( x \right)\].
The graph can be plotted in the following way-
Complete step-by-step answer:
Now let us find out the possible formula for \[g\left( x \right)\] in terms of \[f\left( x \right)\].
Since \[f\left( x \right)\] is vertically stretched or shrunk in a graph, we have to multiply a number \[n\], which is greater than 1 if the graph is stretched else with a number less than 1 but greater than 0. This makes the graph shrink.
Contrarily, if we just add \[a\], it will either shift it up if it is positive or shift it down, if it is negative.
Since our given condition is either stretched or shrunk, we get
\[g\left( x \right)=2f\left( x \right)\]
On verifying, we find that
If \[f\left( x \right)=6\]
\[g\left( x \right)=2f\left( x \right)\]
Then, \[2\times 6=12\].
\[\therefore \] The possible formula of \[g\left( x \right)\] in terms of \[f\left( x \right)\] is \[g\left( x \right)=2f\left( x \right)\].
Note: We can notice that when the graph is stretched, we can expect that the graph’s \[y-\]coordinates to be farther from the \[x-\] axis but the input values remains same. In general, the vertical stretch equation is given by \[y=k\centerdot f\left( x \right)\].
The graph can be plotted in the following way-
Recently Updated Pages
Master Class 11 Computer Science: Engaging Questions & Answers for Success
Master Class 11 Business Studies: Engaging Questions & Answers for Success
Master Class 11 Economics: Engaging Questions & Answers for Success
Master Class 11 English: Engaging Questions & Answers for Success
Master Class 11 Maths: Engaging Questions & Answers for Success
Master Class 11 Biology: Engaging Questions & Answers for Success
Trending doubts
One Metric ton is equal to kg A 10000 B 1000 C 100 class 11 physics CBSE
There are 720 permutations of the digits 1 2 3 4 5 class 11 maths CBSE
Discuss the various forms of bacteria class 11 biology CBSE
Draw a diagram of a plant cell and label at least eight class 11 biology CBSE
State the laws of reflection of light
Explain zero factorial class 11 maths CBSE