


Plot the points (x, y) in the following table on the plane, choosing a suitable unit of distances on the axis.
x $2$ $10$ $1$ $3$ y $8$ $7$ $1.253$ $1$
| x | $2$ | $10$ | $1$ | $3$ |
| y | $8$ | $7$ | $1.253$ | $1$ |
Answer
640.2k+ views
Hint: As it is free to choose a suitable unit of distance, we can choose the unit as per our convenience. After drawing the axes, plot the points according to the figure.
Complete step by step answer:
Here what we need to do is to plot the points given in the table. So first we have to draw the x-y plane. Then find the points with a value of x and value of y as given.
Since the values range from $1$ to $10$, we can have a scale of $2$ units.
Let the points be A, B, C, and D.
From the table, it is clear that when x takes the value of $2$, y takes the value of $8$.
Therefore, the first point A is $\left( {2,8} \right)$.
Similarly, when x takes the value of $10$, y takes the value of $7$.
Therefore, next point B is $\left( {10,7} \right)$.
In the same way, when x is $1$, we have y equal to $1.253$.
So, third point C is $\left( {1,1.253} \right)$
And finally, when x is $3$, we have y equal to $1$.
So, the fourth point is $\left( {3,1} \right)$.
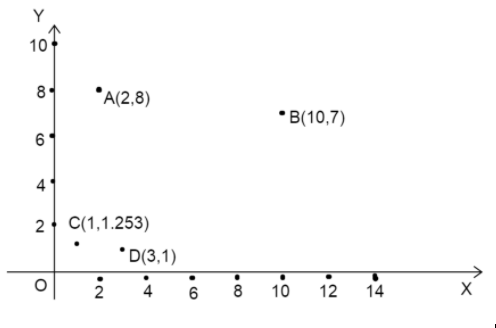
Hence plotting the four points $A\left( {2,8} \right)$, $B\left( {10,7} \right)$, $C\left( {1,1.253} \right)$ and $D\left( {3,1} \right)$, we have the following.
Note:
The point should be careful when drawing graphs is that of the scale. Scales should be chosen in such a way that data are easy to plot and easy to read.
Complete step by step answer:
Here what we need to do is to plot the points given in the table. So first we have to draw the x-y plane. Then find the points with a value of x and value of y as given.
Since the values range from $1$ to $10$, we can have a scale of $2$ units.
Let the points be A, B, C, and D.
From the table, it is clear that when x takes the value of $2$, y takes the value of $8$.
Therefore, the first point A is $\left( {2,8} \right)$.
Similarly, when x takes the value of $10$, y takes the value of $7$.
Therefore, next point B is $\left( {10,7} \right)$.
In the same way, when x is $1$, we have y equal to $1.253$.
So, third point C is $\left( {1,1.253} \right)$
And finally, when x is $3$, we have y equal to $1$.
So, the fourth point is $\left( {3,1} \right)$.
Hence plotting the four points $A\left( {2,8} \right)$, $B\left( {10,7} \right)$, $C\left( {1,1.253} \right)$ and $D\left( {3,1} \right)$, we have the following.
Note:
The point should be careful when drawing graphs is that of the scale. Scales should be chosen in such a way that data are easy to plot and easy to read.

Recently Updated Pages
Basicity of sulphurous acid and sulphuric acid are
Master Class 12 Economics: Engaging Questions & Answers for Success
Master Class 12 Biology: Engaging Questions & Answers for Success
Master Class 11 English: Engaging Questions & Answers for Success
Master Class 11 Physics: Engaging Questions & Answers for Success
Master Class 11 Computer Science: Engaging Questions & Answers for Success
Trending doubts
What is BLO What is the full form of BLO class 8 social science CBSE
Citizens of India can vote at the age of A 18 years class 8 social science CBSE
Full form of STD, ISD and PCO
Give me the opposite gender of Duck class 8 english CBSE
One cusec is equal to how many liters class 8 maths CBSE
What is the feminine gender of a stag class 8 english CBSE