


How do you plot the points D \[( - 6, - 2)\], E \[( - 3, - 2)\],F \[( - 2, - 5)\],G \[( - 7, - 5)\] on a coordinate plane.
Answer
561k+ views
Hint: The coordinate plane which is also known as the Cartesian plane is a plane made up of two axes namely $ x $ and $ y $ axes. The points on a Cartesian plane are usually written as the ordered pair of $ (x,y) $ where $ x $ is the value of the point on $ x $ and $ y $ is the value of the point on the $ y $ axis. The diagram of a coordinate plane is given below:
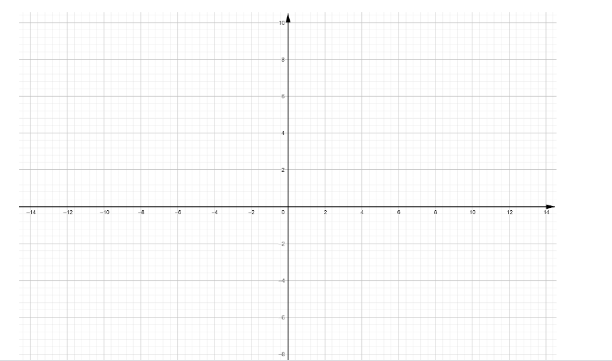
The vertical line is the $ y $ axis and the horizontal line is the $ x $ axis. In the question plot points D,E,F,G at their respective places in the graph.
Complete step by step solution:
Coordinate plane is made up of both $ x $ and $ y $ axes. Each point has its own address on the coordinate plane which is shown by the ordered pair $ (x,y) $ where $ x $ is the value of the point on the $ x $ axis and the $ y $ is the value of the point on $ y $ axis. Now we will plot points on the coordinate plane first we plot the point D
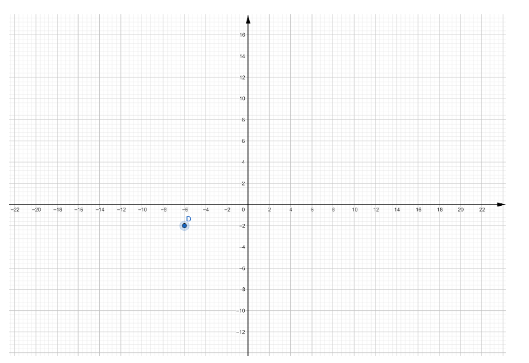
As we can see point D is plotted and its $ x $ value is $ - 6 $ and its $ y $ value is $ - 2 $ . We will now plot the other points as well on the coordinate plane easily . After plotting the remaining point E,F and G our graph would look like as follows:
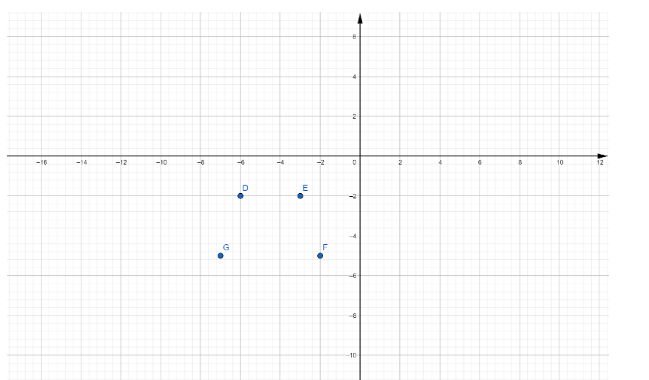
Thus we see that all the required points are plotted on the graph and thus we reach our answer.
Note: Four parts of a graph are called the quadrants so there are four quadrants in a coordinate plane. The axes of a two-dimensional Cartesian system divide the plane into four infinite regions, called quadrants, each bounded by two half-axes. These are often numbered from 1st to 4th and denoted by Roman numerals: I coordinates are I (+; +), II (−; +), III (−; −), and IV (+; −).
The vertical line is the $ y $ axis and the horizontal line is the $ x $ axis. In the question plot points D,E,F,G at their respective places in the graph.
Complete step by step solution:
Coordinate plane is made up of both $ x $ and $ y $ axes. Each point has its own address on the coordinate plane which is shown by the ordered pair $ (x,y) $ where $ x $ is the value of the point on the $ x $ axis and the $ y $ is the value of the point on $ y $ axis. Now we will plot points on the coordinate plane first we plot the point D
As we can see point D is plotted and its $ x $ value is $ - 6 $ and its $ y $ value is $ - 2 $ . We will now plot the other points as well on the coordinate plane easily . After plotting the remaining point E,F and G our graph would look like as follows:
Thus we see that all the required points are plotted on the graph and thus we reach our answer.
Note: Four parts of a graph are called the quadrants so there are four quadrants in a coordinate plane. The axes of a two-dimensional Cartesian system divide the plane into four infinite regions, called quadrants, each bounded by two half-axes. These are often numbered from 1st to 4th and denoted by Roman numerals: I coordinates are I (+; +), II (−; +), III (−; −), and IV (+; −).
Recently Updated Pages
Master Class 12 Business Studies: Engaging Questions & Answers for Success
Master Class 12 Biology: Engaging Questions & Answers for Success
Master Class 12 Chemistry: Engaging Questions & Answers for Success
Class 12 Question and Answer - Your Ultimate Solutions Guide
Master Class 11 Social Science: Engaging Questions & Answers for Success
Master Class 11 English: Engaging Questions & Answers for Success
Trending doubts
Give me the opposite gender of Duck class 8 english CBSE
What are the 12 elements of nature class 8 chemistry CBSE
What is roughage Give two examples class 8 biology CBSE
What is the difference between rai and mustard see class 8 biology CBSE
What are gulf countries and why they are called Gulf class 8 social science CBSE
What is the collective noun for soldiers class 8 english CBSE