


How do you plot the point \[R\left( {0,6} \right)\] ?
Answer
540.9k+ views
Hint: Compare it with \[A\left( {x - coordinate,{\text{ }}y - coordinate} \right)\] and plot
First, we are going to first compare the given point with a standard point format of \[A\left( {x - coordinate,{\text{ }}y - coordinate} \right)\] and after comparing we are going to get the x-coordinate and y-coordinate of the given point, then we are going to plot them according into the graph paper and also set a convenient scale of the graph, such that the point can be easily marked
Complete step-by-step answer:
First, we are given a point \[R\left( {0,6} \right)\]
Now, let us compare this given point with a standard point format for better understanding of the plotting.
The standard format for a point is \[A\left( {x - coordinate,{\text{ }}y - coordinate} \right)\] , after comparing the given point with the standard format, we get
The x-coordinate as $0$and the y-coordinate as$6$.
Since we have understood the coordinates of the given points. Now, we are going to start plotting them on the graph paper.
So, first let us start by marking the x-coordinate first and then the y-coordinate, which gives us the required point
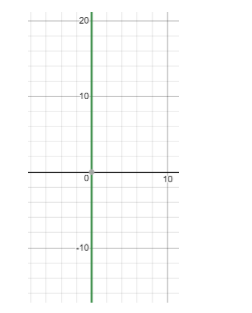
Let’s mark the x-coordinate which is $0$
Here $x = 0$, means that the points lie completely on the y-axis
Next, we are going to mark the y-coordinate=6 on the graph, then we get
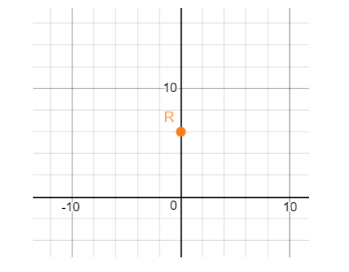
Therefore, we have plotted the given point R whose coordinates are \[\left( {0,6} \right)\]
Note: We have to be careful while plotting by not mixing the coordinates with each other and also, we have to note that we have to set the scale of the graph accordingly such that the point given can be plotted easily.
First, we are going to first compare the given point with a standard point format of \[A\left( {x - coordinate,{\text{ }}y - coordinate} \right)\] and after comparing we are going to get the x-coordinate and y-coordinate of the given point, then we are going to plot them according into the graph paper and also set a convenient scale of the graph, such that the point can be easily marked
Complete step-by-step answer:
First, we are given a point \[R\left( {0,6} \right)\]
Now, let us compare this given point with a standard point format for better understanding of the plotting.
The standard format for a point is \[A\left( {x - coordinate,{\text{ }}y - coordinate} \right)\] , after comparing the given point with the standard format, we get
The x-coordinate as $0$and the y-coordinate as$6$.
Since we have understood the coordinates of the given points. Now, we are going to start plotting them on the graph paper.
So, first let us start by marking the x-coordinate first and then the y-coordinate, which gives us the required point
Let’s mark the x-coordinate which is $0$
Here $x = 0$, means that the points lie completely on the y-axis
Next, we are going to mark the y-coordinate=6 on the graph, then we get
Therefore, we have plotted the given point R whose coordinates are \[\left( {0,6} \right)\]
Note: We have to be careful while plotting by not mixing the coordinates with each other and also, we have to note that we have to set the scale of the graph accordingly such that the point given can be plotted easily.

Recently Updated Pages
Master Class 11 English: Engaging Questions & Answers for Success
Master Class 11 Maths: Engaging Questions & Answers for Success
Master Class 11 Biology: Engaging Questions & Answers for Success
Master Class 11 Social Science: Engaging Questions & Answers for Success
Master Class 11 Physics: Engaging Questions & Answers for Success
Master Class 11 Accountancy: Engaging Questions & Answers for Success
Trending doubts
What is BLO What is the full form of BLO class 8 social science CBSE
Citizens of India can vote at the age of A 18 years class 8 social science CBSE
Full form of STD, ISD and PCO
Convert 40circ C to Fahrenheit A 104circ F B 107circ class 8 maths CBSE
Advantages and disadvantages of science
Right to vote is a AFundamental Right BFundamental class 8 social science CBSE