


Plot the point (0, -4) on a graph paper.
Answer
558.3k+ views
Hint: In this type of question we have to use the concept of plotting a point on a graph paper. We know that when we consider a point (a, b) then a will represent x-coordinate and b will represent y-coordinate of that point. We have to draw a coordinate axis first that is x-axis and y-axis. Then we have to decide how many sides of the small squares may be taken as one unit such that one centimetre represents one unit on both axes. According to that unit and sign, the location of the point is found.
Complete step-by-step solution:
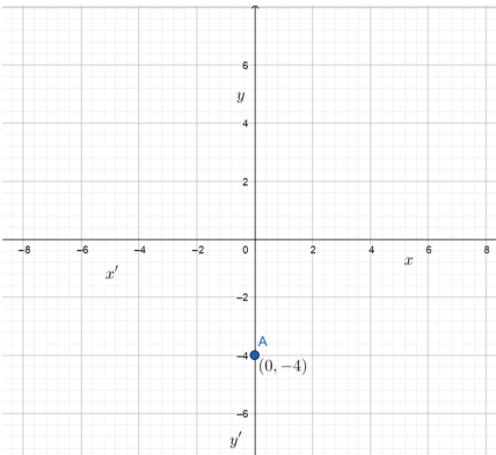
Now, we have to plot the point (0, -4) on a graph paper.
Let us take the length of one division of squares as one unit.
In point (0, -4) we can observe that x-coordinate is zero and y-coordinate is negative so the point will lie on the y-axis.
Now, as y-coordinate is negative the point will lie on the negative y-axis that is in downward direction.
To plot the point counts 4 units along the y-axis downward.
Note: In this type of question we have to observe the coordinates of the point as position of point depends on them. Also we have to note that the coordinates of any point on the y-axis are of the form (0, y). Therefore, the x-coordinate of every point on the y-axis is zero.
Complete step-by-step solution:
Now, we have to plot the point (0, -4) on a graph paper.
Let us take the length of one division of squares as one unit.
In point (0, -4) we can observe that x-coordinate is zero and y-coordinate is negative so the point will lie on the y-axis.
Now, as y-coordinate is negative the point will lie on the negative y-axis that is in downward direction.
To plot the point counts 4 units along the y-axis downward.
Note: In this type of question we have to observe the coordinates of the point as position of point depends on them. Also we have to note that the coordinates of any point on the y-axis are of the form (0, y). Therefore, the x-coordinate of every point on the y-axis is zero.
Recently Updated Pages
Master Class 9 General Knowledge: Engaging Questions & Answers for Success
Master Class 9 Maths: Engaging Questions & Answers for Success
Master Class 9 Science: Engaging Questions & Answers for Success
Master Class 9 English: Engaging Questions & Answers for Success
Master Class 9 Social Science: Engaging Questions & Answers for Success
Class 9 Question and Answer - Your Ultimate Solutions Guide
Trending doubts
Find the sum of series 1 + 2 + 3 + 4 + 5 + + 100 class 9 maths CBSE
Difference Between Plant Cell and Animal Cell
Fill the blanks with the suitable prepositions 1 The class 9 english CBSE
What is pollution? How many types of pollution? Define it
Name 10 Living and Non living things class 9 biology CBSE
What is the full form of pH?