


How do you plot the ordered pairs on the rectangular coordinate system \[(5.1,3.2)\] and \[(-2.5,4.9)\]?
Answer
567.6k+ views
Hint: From the question we are asked how can we plot the given ordered pairs on a rectangular coordinate plane. So, for solving this question we will take the values of x on the right and left of the plane and we will take the values of y ordinate to the top and bottom of the coordinate plane. Thus, we plot the given points.
Complete step-by-step solution:
Generally, to plot the given points or any other points on the coordinate grid:
For x value go to the right if the number is positive and we go to the left if the number is negative.
Then for the value of y ordinate we will go up if the number is positive and we go down if the number is negative.
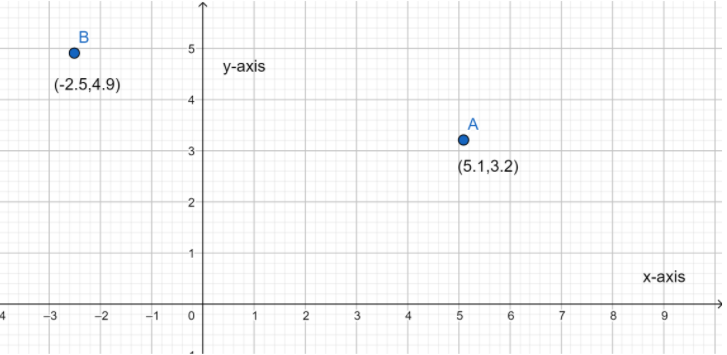
For the first plot \[(5.1,3.2)\]
Because the x value is positive go to the right \[5.1\] from the origin and then go up \[3.2\] as the y value is also positive.
For the second plot \[(-2.5,4.9)\]
Because the x value is negative go to the left \[2.5\] from the origin and then go up \[4.9\] because the y value is positive.
So, the graph will be as follows.
Note: Students should know how to plot points in a graph. We must know the coordinate plane system very thoroughly to solve questions of this sort. We must keep in mind that for negative points of x we will go to the left of origin and for negative y points we must go to the bottom of origin. We should not confuse this or else our solution may become wrong.
Complete step-by-step solution:
Generally, to plot the given points or any other points on the coordinate grid:
For x value go to the right if the number is positive and we go to the left if the number is negative.
Then for the value of y ordinate we will go up if the number is positive and we go down if the number is negative.
For the first plot \[(5.1,3.2)\]
Because the x value is positive go to the right \[5.1\] from the origin and then go up \[3.2\] as the y value is also positive.
For the second plot \[(-2.5,4.9)\]
Because the x value is negative go to the left \[2.5\] from the origin and then go up \[4.9\] because the y value is positive.
So, the graph will be as follows.
Note: Students should know how to plot points in a graph. We must know the coordinate plane system very thoroughly to solve questions of this sort. We must keep in mind that for negative points of x we will go to the left of origin and for negative y points we must go to the bottom of origin. We should not confuse this or else our solution may become wrong.
Recently Updated Pages
Master Class 12 Economics: Engaging Questions & Answers for Success
Master Class 12 English: Engaging Questions & Answers for Success
Master Class 12 Social Science: Engaging Questions & Answers for Success
Master Class 12 Maths: Engaging Questions & Answers for Success
Master Class 12 Physics: Engaging Questions & Answers for Success
Master Class 12 Business Studies: Engaging Questions & Answers for Success
Trending doubts
Which are the Top 10 Largest Countries of the World?
Draw a labelled sketch of the human eye class 12 physics CBSE
Differentiate between homogeneous and heterogeneous class 12 chemistry CBSE
Why is the cell called the structural and functional class 12 biology CBSE
Draw ray diagrams each showing i myopic eye and ii class 12 physics CBSE
Which is the correct genotypic ratio of mendel dihybrid class 12 biology CBSE