


How do you plot the function $ y=\dfrac{7}{2}x-2 $ on a graph?
Answer
605.7k+ views
Hint:
We start solving the problem by recalling the fact that we need at least two points to draw a line. We then find the point at which the given line intersects the y-axis by using the fact that the value of x-coordinate on the y-axis is zero. We then find the point at which the given line intersects the x-axis by using the fact that the value of y-coordinate on the x-axis is zero. We then represent these two points on the plot and then join those points to get the required plot.
Complete step by step answer:
According to the problem, we are asked to plot the given function $ y=\dfrac{7}{2}x-2 $ on a graph.
We can see that the given equation $ y=\dfrac{7}{2}x-2 $ resembles the slope form of the equation of the line $ y=mx+c $.
We know that in order to draw a line, we at least need two points. So, let us find the points at which the given line intersects the x-axis and y-axis.
Now, let us find the point at which the line intersects the y-axis. We know that the value of the x-coordinate on the y-axis is zero. Let us substitute $ x=0 $ in the given equation to find the intersection point.
So, we get $ y=\dfrac{7}{2}\left( 0 \right)-2 $ .
$ \Rightarrow y=0-2 $ .
$ \Rightarrow y=-2 $ .
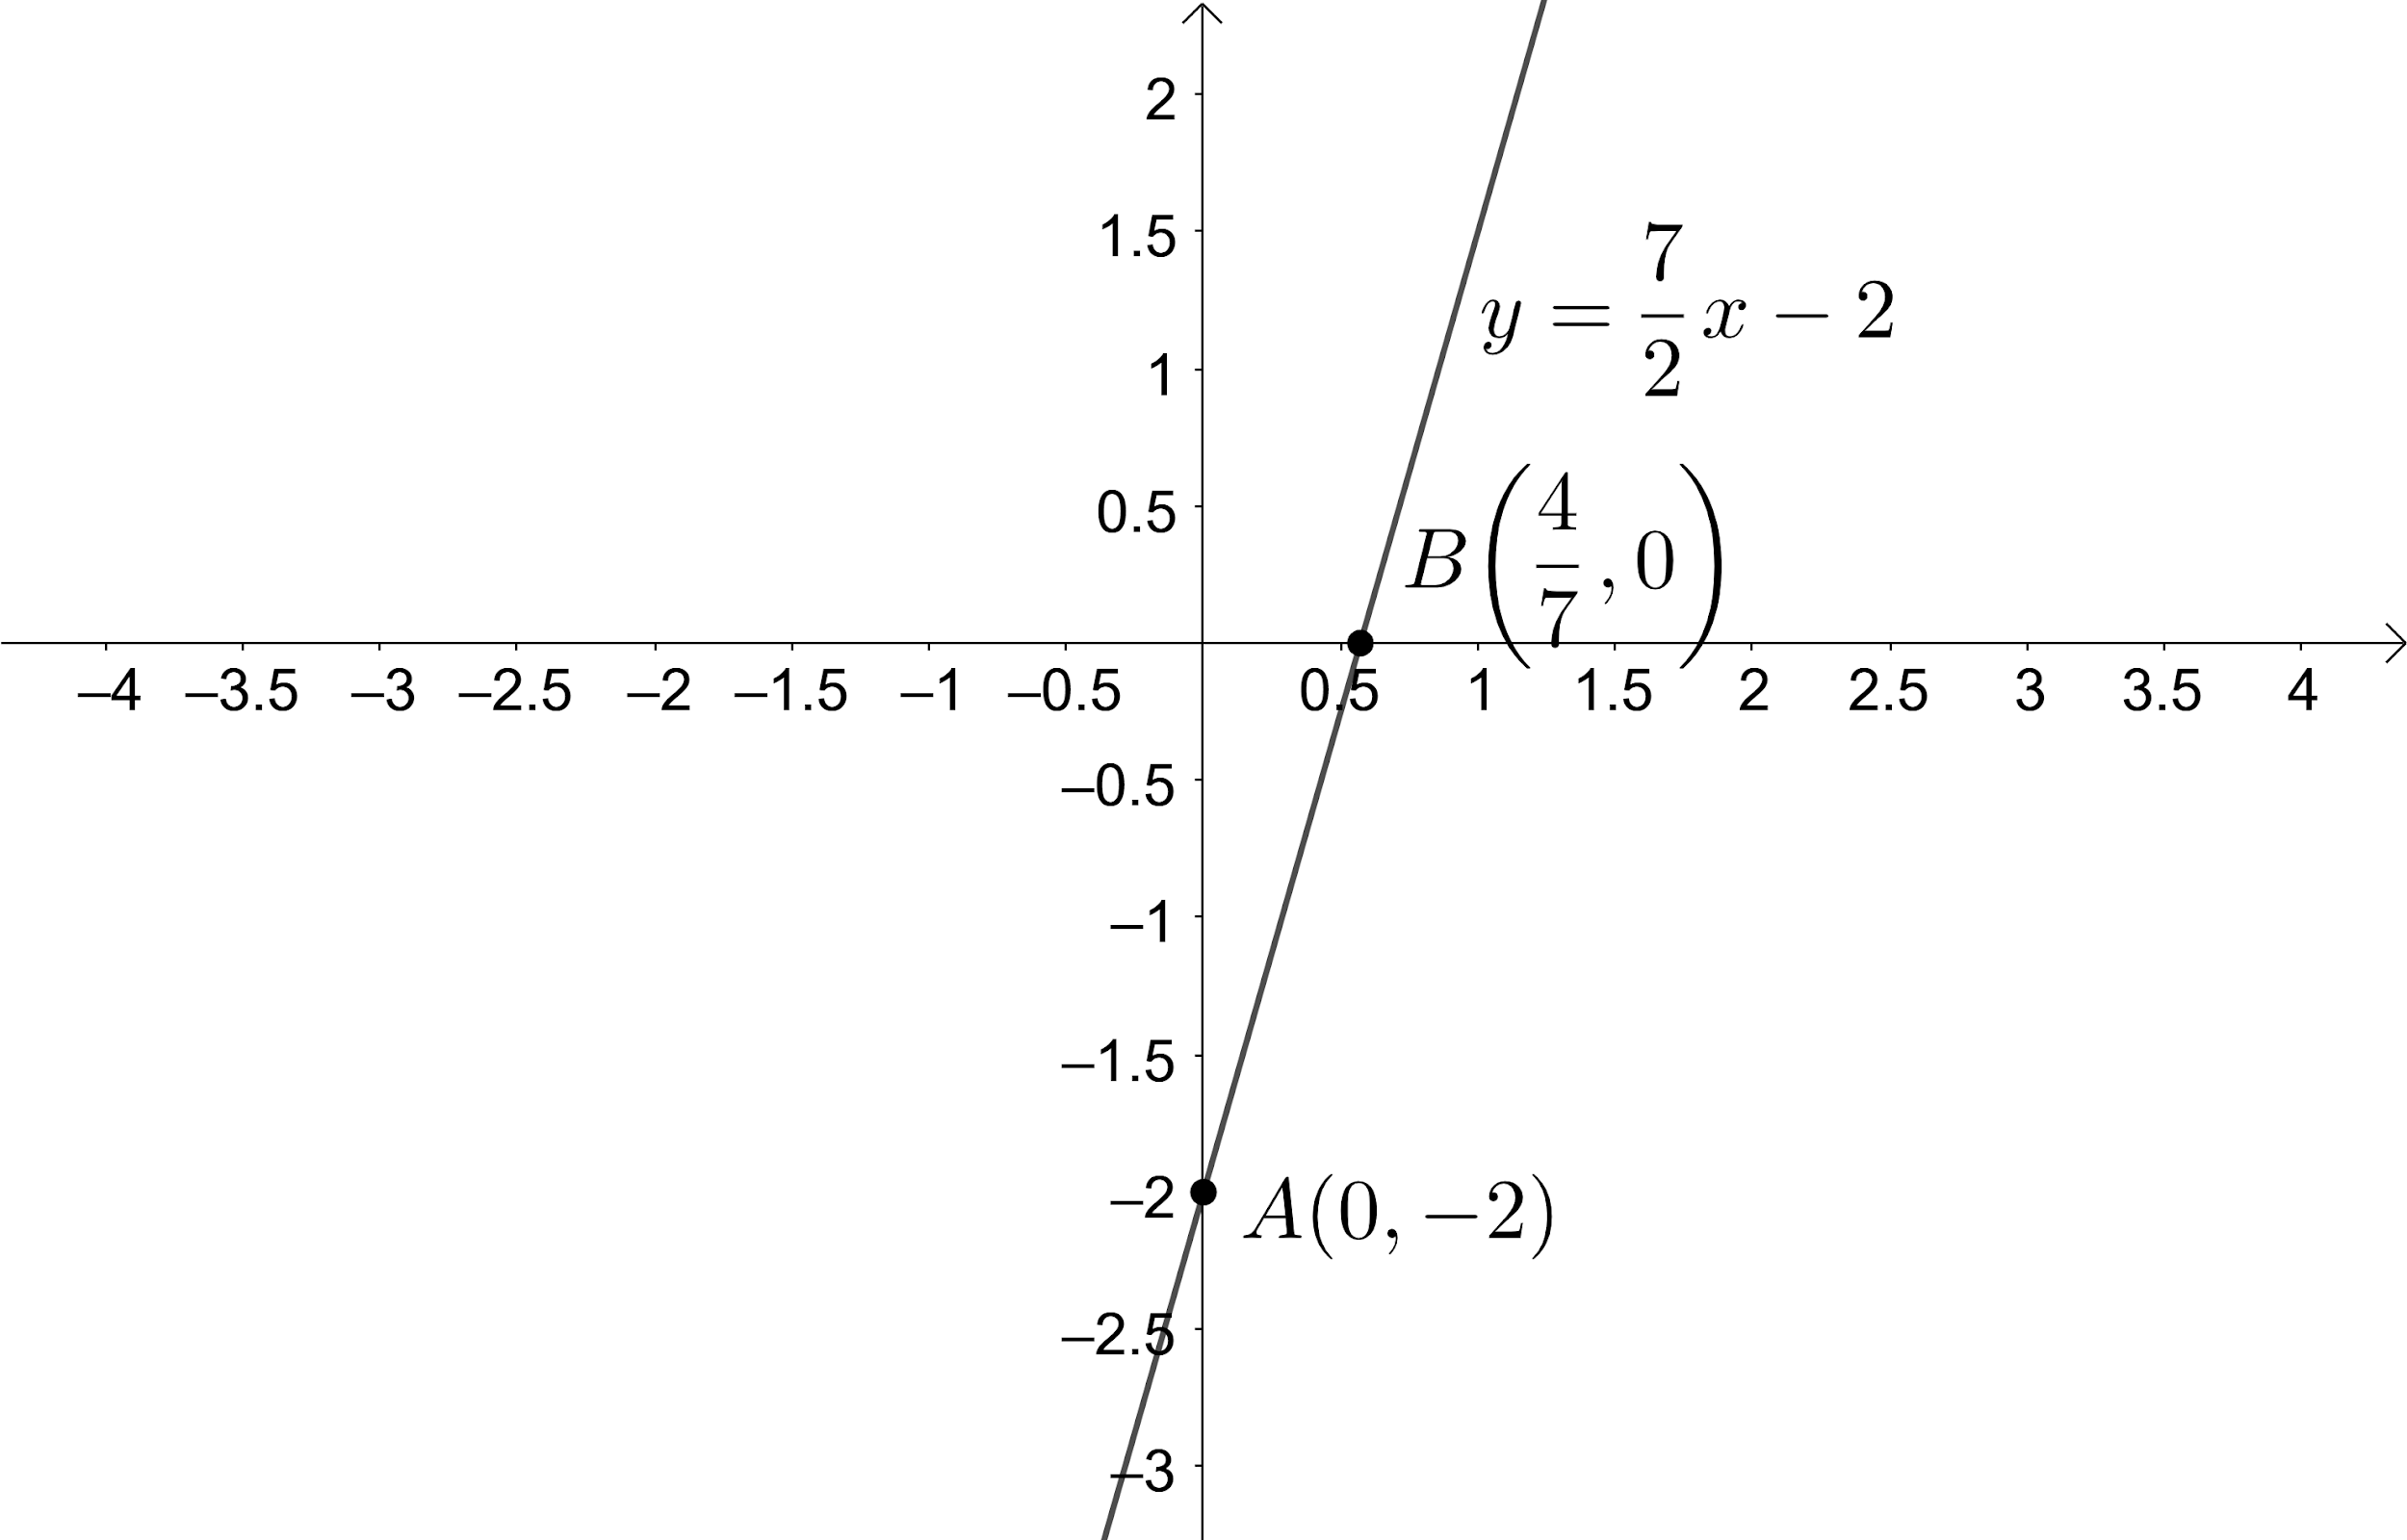
So, the intersection point of the line $ y=\dfrac{7}{2}x-2 $ with y-axis is $ A\left( 0,-2 \right) $ .
Now, let us find the point at which the line intersects the x-axis. We know that the value of the y-coordinate on the x-axis is zero. Let us substitute $ y=0 $ in the given equation to find the intersection point.
So, we get $ 0=\dfrac{7}{2}x-2 $ .
$ \Rightarrow \dfrac{7}{2}x=2 $ .
$ \Rightarrow x=\dfrac{4}{7} $ .
So, the intersection point of the line $ y=\dfrac{7}{2}x-2 $ with x-axis is $ B\left( \dfrac{4}{7},0 \right) $ .
Now, let us plot the given line by representing and joining the obtained two points on the graph which is as shown below:
Note:
Whenever we get this type of problem, we first try to find the points at which the given curve intersects both the axes. We can also plot the given equation by assuming the values for x to find the points which will help to plot on the graph. Similarly, we can expect problems to plot the function $ y={{x}^{2}}-x+1 $ on the graph.
We start solving the problem by recalling the fact that we need at least two points to draw a line. We then find the point at which the given line intersects the y-axis by using the fact that the value of x-coordinate on the y-axis is zero. We then find the point at which the given line intersects the x-axis by using the fact that the value of y-coordinate on the x-axis is zero. We then represent these two points on the plot and then join those points to get the required plot.
Complete step by step answer:
According to the problem, we are asked to plot the given function $ y=\dfrac{7}{2}x-2 $ on a graph.
We can see that the given equation $ y=\dfrac{7}{2}x-2 $ resembles the slope form of the equation of the line $ y=mx+c $.
We know that in order to draw a line, we at least need two points. So, let us find the points at which the given line intersects the x-axis and y-axis.
Now, let us find the point at which the line intersects the y-axis. We know that the value of the x-coordinate on the y-axis is zero. Let us substitute $ x=0 $ in the given equation to find the intersection point.
So, we get $ y=\dfrac{7}{2}\left( 0 \right)-2 $ .
$ \Rightarrow y=0-2 $ .
$ \Rightarrow y=-2 $ .
So, the intersection point of the line $ y=\dfrac{7}{2}x-2 $ with y-axis is $ A\left( 0,-2 \right) $ .
Now, let us find the point at which the line intersects the x-axis. We know that the value of the y-coordinate on the x-axis is zero. Let us substitute $ y=0 $ in the given equation to find the intersection point.
So, we get $ 0=\dfrac{7}{2}x-2 $ .
$ \Rightarrow \dfrac{7}{2}x=2 $ .
$ \Rightarrow x=\dfrac{4}{7} $ .
So, the intersection point of the line $ y=\dfrac{7}{2}x-2 $ with x-axis is $ B\left( \dfrac{4}{7},0 \right) $ .
Now, let us plot the given line by representing and joining the obtained two points on the graph which is as shown below:
Note:
Whenever we get this type of problem, we first try to find the points at which the given curve intersects both the axes. We can also plot the given equation by assuming the values for x to find the points which will help to plot on the graph. Similarly, we can expect problems to plot the function $ y={{x}^{2}}-x+1 $ on the graph.
Recently Updated Pages
Master Class 11 English: Engaging Questions & Answers for Success
Master Class 11 Social Science: Engaging Questions & Answers for Success
Master Class 11 Maths: Engaging Questions & Answers for Success
Master Class 11 Biology: Engaging Questions & Answers for Success
Master Class 11 Physics: Engaging Questions & Answers for Success
Master Class 11 Chemistry: Engaging Questions & Answers for Success
Trending doubts
Explain the Treaty of Vienna of 1815 class 10 social science CBSE
What is the Total Duration of Football Match?
First Cotton Mill of India
In which year voting age was reduced from 21 to 18?
10 examples of evaporation in daily life with explanations
What planets have no moons Which one has only one moon class 10 physics CBSE