


Plot the following points on the same graph paper:
$ A(2,\dfrac{5}{2}),\,B( - \dfrac{3}{2},3),\,C(\dfrac{1}{2},\dfrac{3}{2})\,and\,D( - \dfrac{5}{2}, - \dfrac{1}{2}) $
Answer
565.2k+ views
Hint: Coordinates are two numbers separated by a comma and they are always written in brackets. Coordinates are ordered pairs of numbers; the first number indicates the point on the x-axis and the second the point on the y-axis. A number on the x-axis is called x-coordinate. The x-coordinate is also called abscissa and a number on the y-axis is called y-coordinate. The y-coordinate is also called ordinate. For plotting points on a graph, we have to first identify the quadrant or axis in which the point lies.
Complete step-by-step answer:
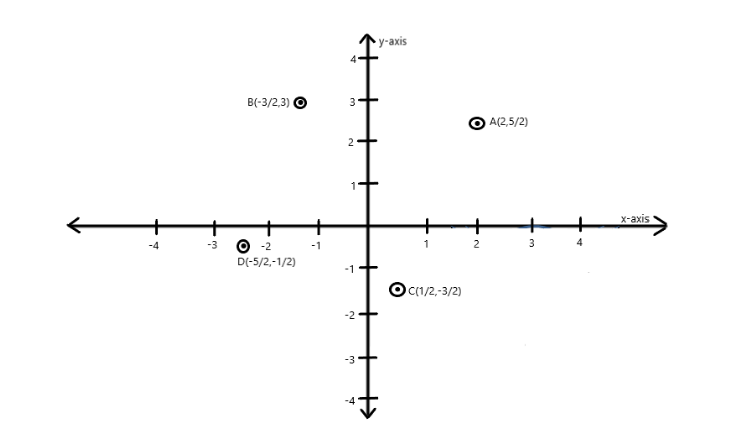
For the point $ A(2,\dfrac{5}{2}) $ , the x-coordinate is $ 2 $ and the y-coordinate is $ \dfrac{5}{2} $ , both of the values are positive so point A lies in the first quadrant.
For the point $ B( - \dfrac{3}{2},3) $ , the x-coordinate is $ - \dfrac{3}{2} $ and the y-coordinate is $ 3 $ , the value of x-coordinate is negative while that of y-coordinate is positive so point B lies in the second quadrant.
For the point $ C(\dfrac{1}{2}, - \dfrac{3}{2}) $ , the x-coordinate is $ \dfrac{1}{2} $ and the y-coordinate is $ - \dfrac{3}{2} $ , the value of y-coordinate is negative while that of x-coordinate is positive so point C lies in the fourth quadrant.
For the point $ D( - \dfrac{5}{2}, - \dfrac{1}{2}) $ , the x-coordinate is $ - \dfrac{5}{2} $ and the y-coordinate is $ - \dfrac{1}{2} $ , both of the values are negative so point D lies in the third quadrant.
Below is the graph obtained on plotting all these points in the same graph –
Note: A graph consists of two axes intersecting at right-angles; their point of intersection is called the origin. The axis parallel to the horizontal lines of the paper is called the x-axis. It and the axis parallel to the vertical lines of parallel that is perpendicular to the x-axis is called the y-axis. A diagram showing the relation between variable quantities, typically of two variables, each measured along one of a pair of axes is called a graph.
Complete step-by-step answer:
For the point $ A(2,\dfrac{5}{2}) $ , the x-coordinate is $ 2 $ and the y-coordinate is $ \dfrac{5}{2} $ , both of the values are positive so point A lies in the first quadrant.
For the point $ B( - \dfrac{3}{2},3) $ , the x-coordinate is $ - \dfrac{3}{2} $ and the y-coordinate is $ 3 $ , the value of x-coordinate is negative while that of y-coordinate is positive so point B lies in the second quadrant.
For the point $ C(\dfrac{1}{2}, - \dfrac{3}{2}) $ , the x-coordinate is $ \dfrac{1}{2} $ and the y-coordinate is $ - \dfrac{3}{2} $ , the value of y-coordinate is negative while that of x-coordinate is positive so point C lies in the fourth quadrant.
For the point $ D( - \dfrac{5}{2}, - \dfrac{1}{2}) $ , the x-coordinate is $ - \dfrac{5}{2} $ and the y-coordinate is $ - \dfrac{1}{2} $ , both of the values are negative so point D lies in the third quadrant.
Below is the graph obtained on plotting all these points in the same graph –
Note: A graph consists of two axes intersecting at right-angles; their point of intersection is called the origin. The axis parallel to the horizontal lines of the paper is called the x-axis. It and the axis parallel to the vertical lines of parallel that is perpendicular to the x-axis is called the y-axis. A diagram showing the relation between variable quantities, typically of two variables, each measured along one of a pair of axes is called a graph.

Recently Updated Pages
Master Class 8 Social Science: Engaging Questions & Answers for Success
Master Class 8 English: Engaging Questions & Answers for Success
Class 8 Question and Answer - Your Ultimate Solutions Guide
Master Class 8 Maths: Engaging Questions & Answers for Success
Master Class 8 Science: Engaging Questions & Answers for Success
Master Class 9 General Knowledge: Engaging Questions & Answers for Success
Trending doubts
What is BLO What is the full form of BLO class 8 social science CBSE
Citizens of India can vote at the age of A 18 years class 8 social science CBSE
Full form of STD, ISD and PCO
Advantages and disadvantages of science
Right to vote is a AFundamental Right BFundamental class 8 social science CBSE
What are the 12 elements of nature class 8 chemistry CBSE