


Plot the following points on a graph paper and find out in which quadrant do they lie:
(a) \[{\rm{A}}\left( {3,5} \right)\] (b) \[{\rm{B}}\left( { - 2,7} \right)\] (c) \[{\rm{C}}\left( { - 3, - 5} \right)\] (d) \[{\rm{D}}\left( {2, - 7} \right)\] (e) \[{\rm{O}}\left( {0,0} \right)\]
Answer
594.3k+ views
Hint: Here, we will first plot all the points on a graph paper. Then, using the graph, we will find out in which quadrant does each point lie in. There are four quadrants, where the first quadrant has only positive points whereas in the fourth quadrant all points are negative.
Complete step-by-step answer:
First, we will plot the given points on a graph paper.
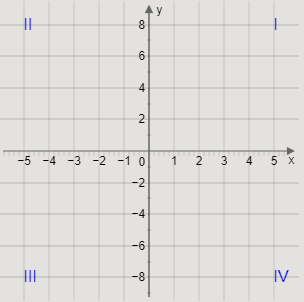
Let us draw the graph with the scale such that each box on the\[x\] axis is 1 unit, and each box on \[y\] axis is 2 units.
We will also mark the quadrant names on the graph.
Thus, we get the following graph.
Now, we will plot the given points on the graph.
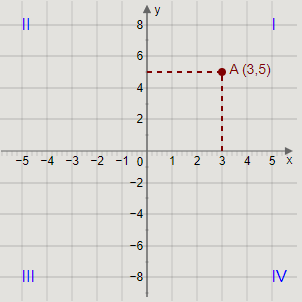
(a) \[{\rm{A}}\left( {3,5} \right)\]
To plot A, we will draw lines from 3 on the \[x\] axis and 5 on the \[y\] axis. The point where these two lines intersect is the required point \[{\rm{A}}\left( {3,5} \right)\].
Plotting the point A on the graph, we get the graph as
Similarly, we will point the other points on the graph.
Plotting the points \[{\rm{B}}\left( { - 2,7} \right)\], \[{\rm{C}}\left( { - 3, - 5} \right)\], \[{\rm{D}}\left( {2, - 7} \right)\], and \[{\rm{O}}\left( {0,0} \right)\] on the graph, we get the graph as
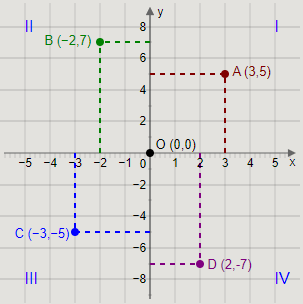
Thus, we have plotted the points on the graph.
Now, we will use the graph to find the quadrants in which each point lies in.
We have marked the quadrant names on the graph paper.
From the graph, we can observe that
The point \[{\rm{A}}\left( {3,5} \right)\] lies in quadrant I.
The point \[{\rm{B}}\left( { - 2,7} \right)\] lies in quadrant II.
The point \[{\rm{C}}\left( { - 3, - 5} \right)\] lies in quadrant III.
The point \[{\rm{D}}\left( {2, - 7} \right)\] lies in quadrant IV.
The point \[{\rm{O}}\left( {0,0} \right)\] does not lie in any of the quadrants. It is the intersection point of the \[x\] axis and the \[y\] axis. The point \[{\rm{O}}\left( {0,0} \right)\] is called the origin.
Note: We marked the four quadrants on the graph paper. We can use the coordinates of a point to determine in which quadrant the point lies in, or on which axis the point lies on.
Quadrant I includes all the points \[\left( {x,y} \right)\] where \[x > 0\] and \[y > 0\]. For example, \[{\rm{A}}\left( {3,5} \right)\].
Quadrant II includes all the points \[\left( {x,y} \right)\] where \[x < 0\] and \[y > 0\]. For example, \[{\rm{B}}\left( { - 2,7} \right)\].
Quadrant III includes all the points \[\left( {x,y} \right)\] where \[x < 0\] and \[y < 0\]. For example, \[{\rm{C}}\left( { - 3, - 5} \right)\].
Quadrant IV includes all the points \[\left( {x,y} \right)\] where \[x > 0\] and \[y < 0\]. For example, \[{\rm{D}}\left( {2, - 7} \right)\].
The points \[\left( {x,y} \right)\] where \[x = 0\] lie on the \[y\] axis. For example, \[\left( {0,2} \right)\].
The points \[\left( {x,y} \right)\] where \[y = 0\] lie on the \[x\] axis. For example, \[\left( {2,0} \right)\].
Complete step-by-step answer:
First, we will plot the given points on a graph paper.
Let us draw the graph with the scale such that each box on the\[x\] axis is 1 unit, and each box on \[y\] axis is 2 units.
We will also mark the quadrant names on the graph.
Thus, we get the following graph.
Now, we will plot the given points on the graph.
(a) \[{\rm{A}}\left( {3,5} \right)\]
To plot A, we will draw lines from 3 on the \[x\] axis and 5 on the \[y\] axis. The point where these two lines intersect is the required point \[{\rm{A}}\left( {3,5} \right)\].
Plotting the point A on the graph, we get the graph as
Similarly, we will point the other points on the graph.
Plotting the points \[{\rm{B}}\left( { - 2,7} \right)\], \[{\rm{C}}\left( { - 3, - 5} \right)\], \[{\rm{D}}\left( {2, - 7} \right)\], and \[{\rm{O}}\left( {0,0} \right)\] on the graph, we get the graph as
Thus, we have plotted the points on the graph.
Now, we will use the graph to find the quadrants in which each point lies in.
We have marked the quadrant names on the graph paper.
From the graph, we can observe that
The point \[{\rm{A}}\left( {3,5} \right)\] lies in quadrant I.
The point \[{\rm{B}}\left( { - 2,7} \right)\] lies in quadrant II.
The point \[{\rm{C}}\left( { - 3, - 5} \right)\] lies in quadrant III.
The point \[{\rm{D}}\left( {2, - 7} \right)\] lies in quadrant IV.
The point \[{\rm{O}}\left( {0,0} \right)\] does not lie in any of the quadrants. It is the intersection point of the \[x\] axis and the \[y\] axis. The point \[{\rm{O}}\left( {0,0} \right)\] is called the origin.
Note: We marked the four quadrants on the graph paper. We can use the coordinates of a point to determine in which quadrant the point lies in, or on which axis the point lies on.
Quadrant I includes all the points \[\left( {x,y} \right)\] where \[x > 0\] and \[y > 0\]. For example, \[{\rm{A}}\left( {3,5} \right)\].
Quadrant II includes all the points \[\left( {x,y} \right)\] where \[x < 0\] and \[y > 0\]. For example, \[{\rm{B}}\left( { - 2,7} \right)\].
Quadrant III includes all the points \[\left( {x,y} \right)\] where \[x < 0\] and \[y < 0\]. For example, \[{\rm{C}}\left( { - 3, - 5} \right)\].
Quadrant IV includes all the points \[\left( {x,y} \right)\] where \[x > 0\] and \[y < 0\]. For example, \[{\rm{D}}\left( {2, - 7} \right)\].
The points \[\left( {x,y} \right)\] where \[x = 0\] lie on the \[y\] axis. For example, \[\left( {0,2} \right)\].
The points \[\left( {x,y} \right)\] where \[y = 0\] lie on the \[x\] axis. For example, \[\left( {2,0} \right)\].
Recently Updated Pages
Master Class 8 Social Science: Engaging Questions & Answers for Success
Master Class 8 Science: Engaging Questions & Answers for Success
Master Class 8 Maths: Engaging Questions & Answers for Success
Class 8 Question and Answer - Your Ultimate Solutions Guide
Master Class 9 Social Science: Engaging Questions & Answers for Success
Master Class 9 Science: Engaging Questions & Answers for Success
Trending doubts
What are gulf countries and why they are called Gulf class 8 social science CBSE
Give full form of LPG and CNG class 8 chemistry CBSE
Explain land use pattern in India and why has the land class 8 social science CBSE
BC C Backward castes C Category comes under Backward class 8 social science CBSE
10 slogans on organ donation class 8 english CBSE
Write an experiment to show that chlorophyll is necessary class 8 chemistry CBSE