


How do you plot \[ - 7 - i\] on a complex plane?
Answer
546k+ views
Hint: Here in this question we have to plot the graph for the given points. Here we have a complex number. They have given only one value of x and y. Hence by considering the points we plot the graph for the given question. hence the solution is obtained for the given question.
Complete step-by-step solution:
Here in this question, we have to plot the graph for the given function. A graph of a function is a set of ordered pairs and it is represented as \[y = f(x)\], where x and f(x) are real numbers. These pairs are in the form of cartesian form and the graph is the two-dimensional graph.
Here the given number is in the form of a complex number. The general form of complex numbers is defined as \[x + iy\]. When we compare the general and given complex numbers. the value of x is -7 and the value of y is -1.
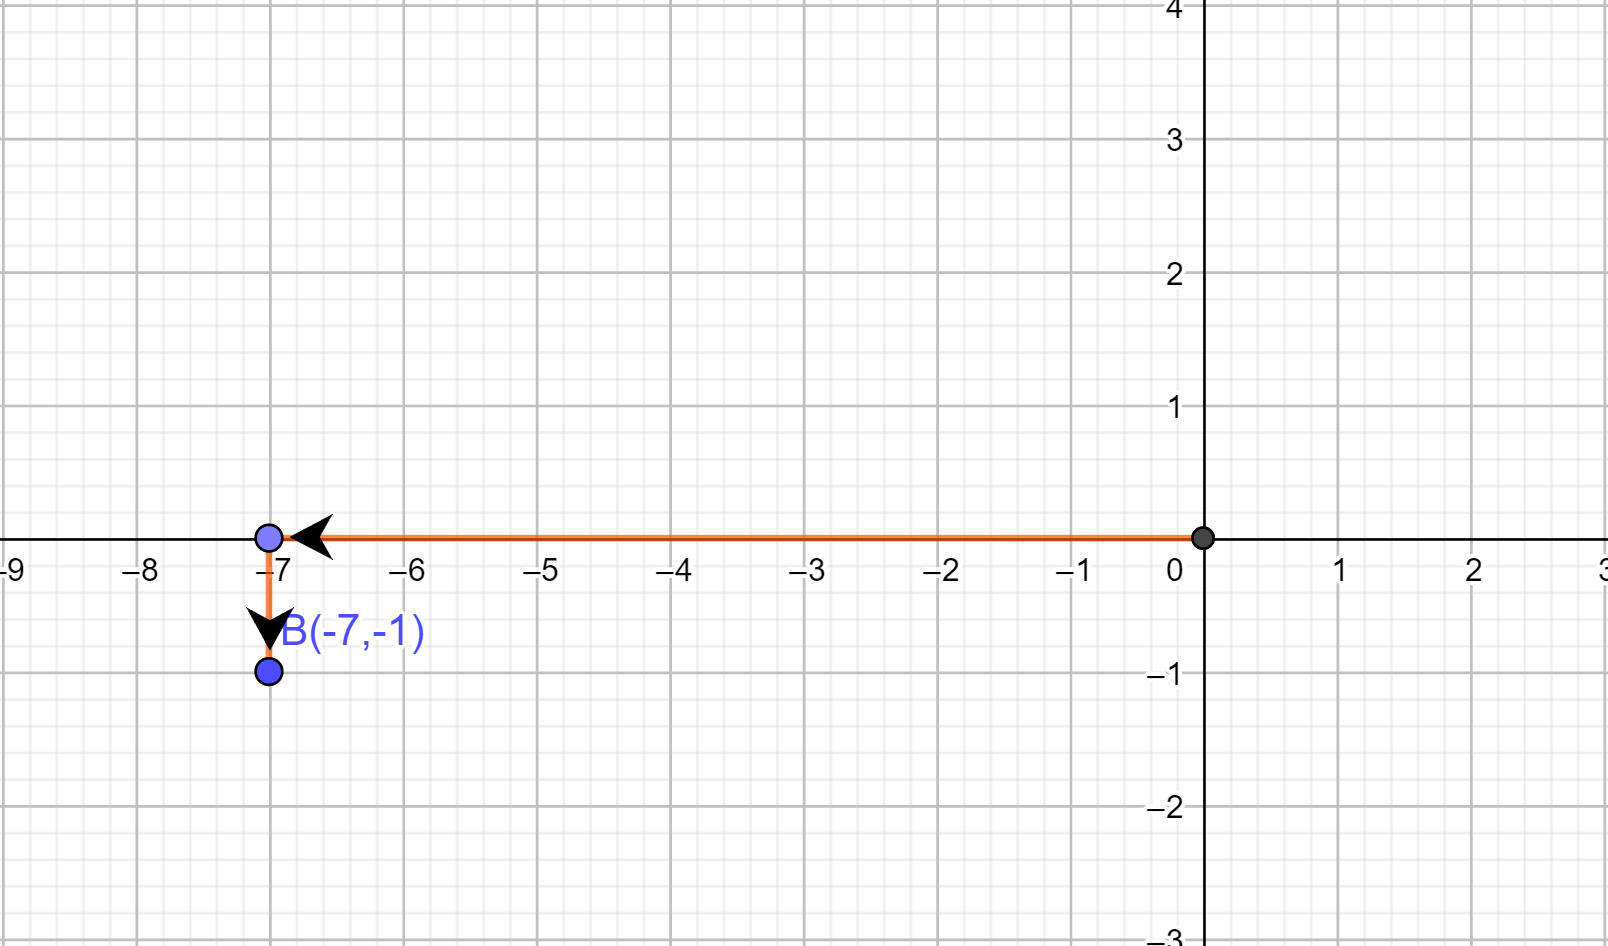
Usually the point is generally represented as \[(x,y)\]. The first term represents the x value and the second term represents the y value. Here we have to plot the graph for the points \[( - 7, - 1)\]. Here when the x value is -7, then the value of y is -1. From the origin of a graph we have to move 7 steps left side and 1 step downwards for the point (-7, -1).
Therefore the graph for the points is plotted as shown below:
Note: The graph is plotted x-axis versus y axis. The graph is two dimensional. By the equation of a graph, we can plot the graph by assuming the value of x. We can’t assume the value of y. because the value of y depends on the value of x. hence, we have plotted the graph.
Complete step-by-step solution:
Here in this question, we have to plot the graph for the given function. A graph of a function is a set of ordered pairs and it is represented as \[y = f(x)\], where x and f(x) are real numbers. These pairs are in the form of cartesian form and the graph is the two-dimensional graph.
Here the given number is in the form of a complex number. The general form of complex numbers is defined as \[x + iy\]. When we compare the general and given complex numbers. the value of x is -7 and the value of y is -1.
Usually the point is generally represented as \[(x,y)\]. The first term represents the x value and the second term represents the y value. Here we have to plot the graph for the points \[( - 7, - 1)\]. Here when the x value is -7, then the value of y is -1. From the origin of a graph we have to move 7 steps left side and 1 step downwards for the point (-7, -1).
Therefore the graph for the points is plotted as shown below:
Note: The graph is plotted x-axis versus y axis. The graph is two dimensional. By the equation of a graph, we can plot the graph by assuming the value of x. We can’t assume the value of y. because the value of y depends on the value of x. hence, we have plotted the graph.
Recently Updated Pages
Master Class 11 Computer Science: Engaging Questions & Answers for Success
Master Class 11 Business Studies: Engaging Questions & Answers for Success
Master Class 11 Economics: Engaging Questions & Answers for Success
Master Class 11 English: Engaging Questions & Answers for Success
Master Class 11 Maths: Engaging Questions & Answers for Success
Master Class 11 Biology: Engaging Questions & Answers for Success
Trending doubts
One Metric ton is equal to kg A 10000 B 1000 C 100 class 11 physics CBSE
There are 720 permutations of the digits 1 2 3 4 5 class 11 maths CBSE
Discuss the various forms of bacteria class 11 biology CBSE
Draw a diagram of a plant cell and label at least eight class 11 biology CBSE
State the laws of reflection of light
Explain zero factorial class 11 maths CBSE