


Oxygen dissociation curve of hemoglobin is
A. Sigmoid
B. Hyperbolic.
C. Linear
D. Hyperbolic
Answer
633k+ views
Hint: Hemoglobin in the combination of heme and globin, which red pigment present in the cytoplasm of the red blood cells, where it helps in the transport of oxygen to all body parts and to carry deoxygenated blood to purify to the lungs.
Complete answer:
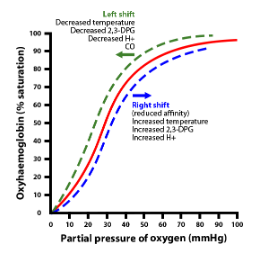
The hemoglobin dissociation curve is also known as the oxy dissociation curve.
The curve is obtained by plotting the graph where the saturation of oxygen in the vertical axis and oxygen affinity or partial pressure in the horizontal axis.
The Oxyhemoglobin curve which obtains is usually a sigmoid in shape.
Mainly it tells about the affinity of oxygen to the hemoglobin and how the hemoglobin carries oxygen.
One heme can carry the four oxygen molecules, the association of oxygen with heme is very difficult, but it occurs if the partial pressure is high, once one oxygen molecule attaches to the hemoglobin, it’s shape changes so that 2nd, 3rd and 4th is easily attached.
In case of more dissolved carbon dioxide, the affinity of oxygen decreases as the partial pressure of oxygen is low, the shape of hemoglobin changes and the slowly carbon dioxide gets attached with hemoglobin and all oxygen molecules get released.
Left shift occurs in the lungs, where the affinity of the oxygen is more.
Right shift occurs in case of low oxygen affinity, and high carbon dioxide concentration, and increase in the body temperature, increase in hydrogen ions and increase in 2- bisphosphoglycerate.
Note:
Oxyhaemoglobin dissociation curve is somewhat different in the fetus, compare to adults, in fetus the affinity of oxygen is more and left relative shifting occurs because in fetal hemoglobin, it consists of 2 alpha and 2 gamma chains, while in adults it is 2 alpha and 2 beta chains.
Complete answer:
The hemoglobin dissociation curve is also known as the oxy dissociation curve.
The curve is obtained by plotting the graph where the saturation of oxygen in the vertical axis and oxygen affinity or partial pressure in the horizontal axis.
The Oxyhemoglobin curve which obtains is usually a sigmoid in shape.
Mainly it tells about the affinity of oxygen to the hemoglobin and how the hemoglobin carries oxygen.
One heme can carry the four oxygen molecules, the association of oxygen with heme is very difficult, but it occurs if the partial pressure is high, once one oxygen molecule attaches to the hemoglobin, it’s shape changes so that 2nd, 3rd and 4th is easily attached.
In case of more dissolved carbon dioxide, the affinity of oxygen decreases as the partial pressure of oxygen is low, the shape of hemoglobin changes and the slowly carbon dioxide gets attached with hemoglobin and all oxygen molecules get released.
Left shift occurs in the lungs, where the affinity of the oxygen is more.
Right shift occurs in case of low oxygen affinity, and high carbon dioxide concentration, and increase in the body temperature, increase in hydrogen ions and increase in 2- bisphosphoglycerate.
Note:
Oxyhaemoglobin dissociation curve is somewhat different in the fetus, compare to adults, in fetus the affinity of oxygen is more and left relative shifting occurs because in fetal hemoglobin, it consists of 2 alpha and 2 gamma chains, while in adults it is 2 alpha and 2 beta chains.
Recently Updated Pages
The given figure shows two endocrine glands marked class 11 biology NEET_UG
Match columnI with columnII and select the correct class 11 biology NEET
Match column I with column II and select the correct class 11 biology NEET_UG
Which floral family has left 9 right + 1 arrangement class 11 biology NEET_UG
Which is not a variety of sheep A Lohi B Beetal C Nellore class 11 biology NEET_UG
Match column I with column II and select the correct class 11 biology NEET_UG
Trending doubts
One Metric ton is equal to kg A 10000 B 1000 C 100 class 11 physics CBSE
Draw a diagram of a plant cell and label at least eight class 11 biology CBSE
Difference Between Prokaryotic Cells and Eukaryotic Cells
Draw a well labelled diagram of reflex arc and explain class 11 biology CBSE
Two of the body parts which do not appear in MRI are class 11 biology CBSE
1 ton equals to A 100 kg B 1000 kg C 10 kg D 10000 class 11 physics CBSE