


On acceleration time graph, a horizontal line indicates:
Answer
547.8k+ views
Hint:The same way as velocity vs time graphs tell us about an object's displacement, acceleration vs time graphs inform us about its velocity. The area under the graph for a specific time interval is equal to the change in velocity during the same time interval.
Complete step by step answer:
The acceleration vs. time graph will show a straight horizontal line at \[y = 0.\] Because acceleration is the derivative of velocity, the slope of the curves on a velocity vs. time graph can be used to predict what an acceleration vs. time graph for an object's motion would look like (much as the slopes of the curves on a position vs. time graph can be used to predict what a \[v\] vs \[t\] graph will look like, because velocity is the first derivative of position).
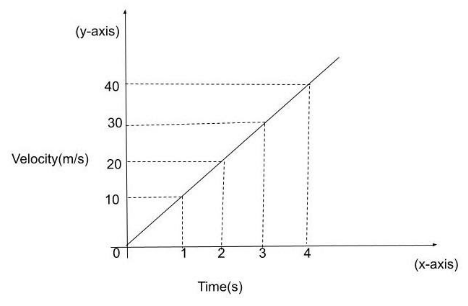
The independent variable on a graph of velocity vs time is time, which is depicted on the x-axis. On the y-axis, velocity is plotted, and the graph depicts how velocity varies over time.A horizontal line on the graph depicts a velocity that is constant through time (e.g., no acceleration). It would apply to an object moving at a constant speed in a vacuum with no external forces acting on it.
If the \[v\] vs $t$ graph's lines are straight and horizontal, indicating that the item is moving at a constant velocity, the slopes of those lines are $0$ , and the $a$ vs \[t\] graph should show a straight, horizontal line at \[y = 0\] (along the z-axis).
Note: If your acceleration is positive at one point, your velocity will increase at that point. If you have a negative acceleration, your velocity will decrease. Finally, if your acceleration is zero, your velocity will remain constant and will not change.
Complete step by step answer:
The acceleration vs. time graph will show a straight horizontal line at \[y = 0.\] Because acceleration is the derivative of velocity, the slope of the curves on a velocity vs. time graph can be used to predict what an acceleration vs. time graph for an object's motion would look like (much as the slopes of the curves on a position vs. time graph can be used to predict what a \[v\] vs \[t\] graph will look like, because velocity is the first derivative of position).
The independent variable on a graph of velocity vs time is time, which is depicted on the x-axis. On the y-axis, velocity is plotted, and the graph depicts how velocity varies over time.A horizontal line on the graph depicts a velocity that is constant through time (e.g., no acceleration). It would apply to an object moving at a constant speed in a vacuum with no external forces acting on it.
If the \[v\] vs $t$ graph's lines are straight and horizontal, indicating that the item is moving at a constant velocity, the slopes of those lines are $0$ , and the $a$ vs \[t\] graph should show a straight, horizontal line at \[y = 0\] (along the z-axis).
Note: If your acceleration is positive at one point, your velocity will increase at that point. If you have a negative acceleration, your velocity will decrease. Finally, if your acceleration is zero, your velocity will remain constant and will not change.
Recently Updated Pages
Master Class 12 Economics: Engaging Questions & Answers for Success
Master Class 12 English: Engaging Questions & Answers for Success
Master Class 12 Social Science: Engaging Questions & Answers for Success
Master Class 12 Maths: Engaging Questions & Answers for Success
Master Class 12 Physics: Engaging Questions & Answers for Success
Master Class 11 Social Science: Engaging Questions & Answers for Success
Trending doubts
One Metric ton is equal to kg A 10000 B 1000 C 100 class 11 physics CBSE
Difference Between Prokaryotic Cells and Eukaryotic Cells
Two of the body parts which do not appear in MRI are class 11 biology CBSE
1 ton equals to A 100 kg B 1000 kg C 10 kg D 10000 class 11 physics CBSE
Draw a diagram of nephron and explain its structur class 11 biology CBSE
10 examples of friction in our daily life