


On a particular day, the sales (in Rupees) of different items of a baker’s shop are given below. Draw a pie chart for this data.
Item Ordinary bread Fruit bread Cakes Biscuits Others Money (rupees) 320 80 160 120 40
| Item | Ordinary bread | Fruit bread | Cakes | Biscuits | Others |
| Money (rupees) | 320 | 80 | 160 | 120 | 40 |
Answer
587.4k+ views
Hint: Here there are different items with different sales. Add the sales of all items. Get the percentage fraction of each item by dividing its sale by total sales. Multiply the percentage fraction with 360 to get the area it occupies on a pie chart.
Complete step-by-step answer:
We are given the sales in rupees of different items of a baker’s shop.
We have to draw a pie chart for this data.
Total sales = Sum of all sales of different items.
$ = 320 + 80 + 160 + 120 + 40 = 720 $
Divide sales of each item with 720 and multiply it with 360
Percentage fraction of Ordinary bread is $ \dfrac{{320}}{{720}} = \dfrac{4}{9} $
$ \dfrac{4}{9} \times 360 = {160^ \circ } $
Percentage fraction of Fruit bread is $ \dfrac{{80}}{{720}} = \dfrac{1}{9} $
$ \dfrac{1}{9} \times 360 = {40^ \circ } $
Percentage fraction of Cakes is $ \dfrac{{160}}{{720}} = \dfrac{2}{9} $
$ \dfrac{2}{9} \times 360 = {80^ \circ } $
Percentage fraction of Biscuits is $ \dfrac{{120}}{{720}} = \dfrac{1}{6} $
$ \dfrac{1}{6} \times 360 = {60^ \circ } $
Percentage fraction of others is $ \dfrac{{40}}{{720}} = \dfrac{1}{{18}} $
$ \dfrac{1}{{18}} \times 360 = {20^ \circ } $
Now using these values of angles draw a pie chart.
Draw a circle with a certain radius and mark its centre.
Draw a radius at any point on the circle and using this radius of circle as the base of the protractor, marks 160 which is the highest angle on it.
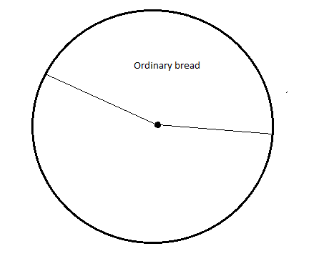
Using the Ordinary bread boundary, mark the next highest angle and repeat this for all other items.
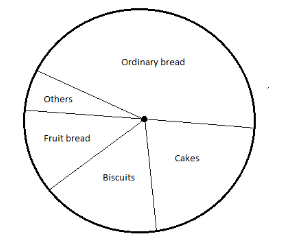
Therefore, the pie chart is ready.
Note: A pie chart which is also called as a circle chart is a circular statistical graphic, which is divided into parts to illustrate numerical proportion. In a pie chart, the arc length of each part is proportional to the quantity it represents.
Complete step-by-step answer:
We are given the sales in rupees of different items of a baker’s shop.
| Item | Ordinary bread | Fruit bread | Cakes | Biscuits | Others |
| Money (rupees) | 320 | 80 | 160 | 120 | 40 |
We have to draw a pie chart for this data.
Total sales = Sum of all sales of different items.
$ = 320 + 80 + 160 + 120 + 40 = 720 $
Divide sales of each item with 720 and multiply it with 360
Percentage fraction of Ordinary bread is $ \dfrac{{320}}{{720}} = \dfrac{4}{9} $
$ \dfrac{4}{9} \times 360 = {160^ \circ } $
Percentage fraction of Fruit bread is $ \dfrac{{80}}{{720}} = \dfrac{1}{9} $
$ \dfrac{1}{9} \times 360 = {40^ \circ } $
Percentage fraction of Cakes is $ \dfrac{{160}}{{720}} = \dfrac{2}{9} $
$ \dfrac{2}{9} \times 360 = {80^ \circ } $
Percentage fraction of Biscuits is $ \dfrac{{120}}{{720}} = \dfrac{1}{6} $
$ \dfrac{1}{6} \times 360 = {60^ \circ } $
Percentage fraction of others is $ \dfrac{{40}}{{720}} = \dfrac{1}{{18}} $
$ \dfrac{1}{{18}} \times 360 = {20^ \circ } $
Now using these values of angles draw a pie chart.
Draw a circle with a certain radius and mark its centre.
Draw a radius at any point on the circle and using this radius of circle as the base of the protractor, marks 160 which is the highest angle on it.
Using the Ordinary bread boundary, mark the next highest angle and repeat this for all other items.
Therefore, the pie chart is ready.
Note: A pie chart which is also called as a circle chart is a circular statistical graphic, which is divided into parts to illustrate numerical proportion. In a pie chart, the arc length of each part is proportional to the quantity it represents.
Recently Updated Pages
Master Class 11 English: Engaging Questions & Answers for Success
Master Class 11 Maths: Engaging Questions & Answers for Success
Master Class 11 Biology: Engaging Questions & Answers for Success
Master Class 11 Social Science: Engaging Questions & Answers for Success
Master Class 11 Physics: Engaging Questions & Answers for Success
Master Class 11 Accountancy: Engaging Questions & Answers for Success
Trending doubts
Difference Between Plant Cell and Animal Cell
Fill the blanks with the suitable prepositions 1 The class 9 english CBSE
Which places in India experience sunrise first and class 9 social science CBSE
Who is eligible for RTE class 9 social science CBSE
What is pollution? How many types of pollution? Define it
Name 10 Living and Non living things class 9 biology CBSE