


Obtain the points to be plotted for the equation $2x - y = 4$ in the graph.
Answer
571.5k+ views
Hint: In this question, we are given an equation and we have been asked to find the points which can be plotted on the graph to represent the equation $2x - y = 4$. To find the points, put different values of x starting from 0 and find values of y respectively. Then plot these points on the graph and connect them. You will get a line which will represent the given equation $2x - y = 4$.
Complete step-by-step solution:
We are given an equation $2x - y = 4$ and we have been asked to plot the points on the graph. We will first find the points.
Step 1: Finding the points.
Put different integral values on x starting from 0 and then find the corresponding values of y.
For example: Put $x = 0$ in $2x - y = 4$.
$ \Rightarrow 0 - y = 4$
$ \Rightarrow y = - 4$
Therefore, we have got one point $\left( {0, - 4} \right)$. Similarly, we can find other 2-3 points and, make a table as below:
Step 2: Now, we have all the required points and the next step is to plot them on the graph.
Step 3: After plotting the points, give each point a name. $A\left( {0, - 4} \right),B\left( {1, - 2} \right),C\left( {2,0} \right),D\left( {3,2} \right)$.
Step 4: Connect all the points to get the required line.
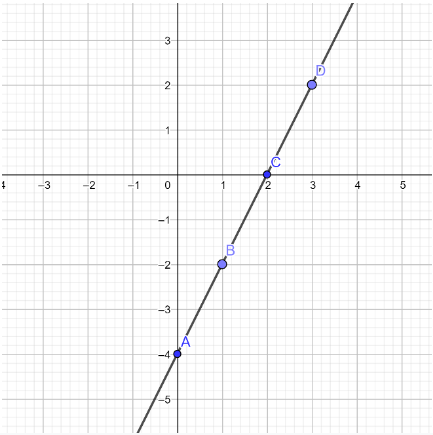
Therefore, this is our graph for the given equation.
Note: We can solve the same in a different way
We are given an equation $2x - y = 4$ and we have been asked to plot the points on the graph. We will first find the points.
Step 1: Finding the points.
Put different integral values on $y$ starting from 0 and then find the corresponding values of y.
For example: Put $y = 0$ in $2x - y = 4$.
$ \Rightarrow 2x - 0 = 4$
$ \Rightarrow 2x = 4$
$ \Rightarrow x = 2$
Therefore, we have got one point $\left( {2,0} \right)$.
Similarly, we can find other by substituting $y$ as $1,{\text{ }}2,{\text{ }}3$ points and, make a table as below:
Step 2: Now, we have all the required points and the next step is to plot them on the graph.
Step 3: After plotting the points, give each point a name. $A\left( {2,0} \right),B\left( {2.5,1} \right),C\left( {3,2} \right),D\left( {3.5,3} \right)$.
Step 4: Connect all the points to get the required line.
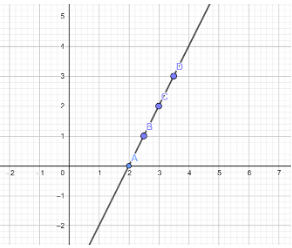
Therefore, this is our graph for the given equation.
Hence, we got the point plotted graph.
Complete step-by-step solution:
We are given an equation $2x - y = 4$ and we have been asked to plot the points on the graph. We will first find the points.
Step 1: Finding the points.
Put different integral values on x starting from 0 and then find the corresponding values of y.
For example: Put $x = 0$ in $2x - y = 4$.
$ \Rightarrow 0 - y = 4$
$ \Rightarrow y = - 4$
Therefore, we have got one point $\left( {0, - 4} \right)$. Similarly, we can find other 2-3 points and, make a table as below:
| $x$ | $0$ | $1$ | $2$ | $3$ |
| $y$ | $ - 4$ | $ - 2$ | $0$ | $2$ |
Step 2: Now, we have all the required points and the next step is to plot them on the graph.
Step 3: After plotting the points, give each point a name. $A\left( {0, - 4} \right),B\left( {1, - 2} \right),C\left( {2,0} \right),D\left( {3,2} \right)$.
Step 4: Connect all the points to get the required line.
Therefore, this is our graph for the given equation.
Note: We can solve the same in a different way
We are given an equation $2x - y = 4$ and we have been asked to plot the points on the graph. We will first find the points.
Step 1: Finding the points.
Put different integral values on $y$ starting from 0 and then find the corresponding values of y.
For example: Put $y = 0$ in $2x - y = 4$.
$ \Rightarrow 2x - 0 = 4$
$ \Rightarrow 2x = 4$
$ \Rightarrow x = 2$
Therefore, we have got one point $\left( {2,0} \right)$.
Similarly, we can find other by substituting $y$ as $1,{\text{ }}2,{\text{ }}3$ points and, make a table as below:
| $x$ | $2$ | $2.5$ | $3$ | $3.5$ |
| $y$ | $0$ | $1$ | $2$ | $3$ |
Step 2: Now, we have all the required points and the next step is to plot them on the graph.
Step 3: After plotting the points, give each point a name. $A\left( {2,0} \right),B\left( {2.5,1} \right),C\left( {3,2} \right),D\left( {3.5,3} \right)$.
Step 4: Connect all the points to get the required line.
Therefore, this is our graph for the given equation.
Hence, we got the point plotted graph.
Recently Updated Pages
Master Class 10 Computer Science: Engaging Questions & Answers for Success
Master Class 10 General Knowledge: Engaging Questions & Answers for Success
Master Class 10 English: Engaging Questions & Answers for Success
Master Class 10 Social Science: Engaging Questions & Answers for Success
Master Class 10 Maths: Engaging Questions & Answers for Success
Master Class 10 Science: Engaging Questions & Answers for Success
Trending doubts
What is the median of the first 10 natural numbers class 10 maths CBSE
Which women's tennis player has 24 Grand Slam singles titles?
Who is the Brand Ambassador of Incredible India?
Why is there a time difference of about 5 hours between class 10 social science CBSE
Write a letter to the principal requesting him to grant class 10 english CBSE
A moving boat is observed from the top of a 150 m high class 10 maths CBSE