


When $n$ is small (less than $30$ ), how does the shape of the $t$ distribution compare to the normal distribution?
Answer
532.2k+ views
Hint: Here in this question we have been asked to compare the shape of the $t$ distribution with that of the normal distribution, when $n$ is small (less than $30$ ). We know that $t$ distribution is a type of probability distribution that is similar to the normal distribution and it has a greater chance for extreme values than normal distribution.
Complete step-by-step answer:
Now considering from the question we have been asked to compare the shape of the $t$ distribution with that of the normal distribution, when $n$ is small (less than $30$ ).
We know that $t$ distribution is a type of probability distribution that is similar to the normal distribution and it has a greater chance for extreme values than normal distribution.
Here a diagram is shown for $t$ distributions of different degrees and normal distribution in a single plot so that we can compare them easily. Observe them carefully and draw the required conclusions.
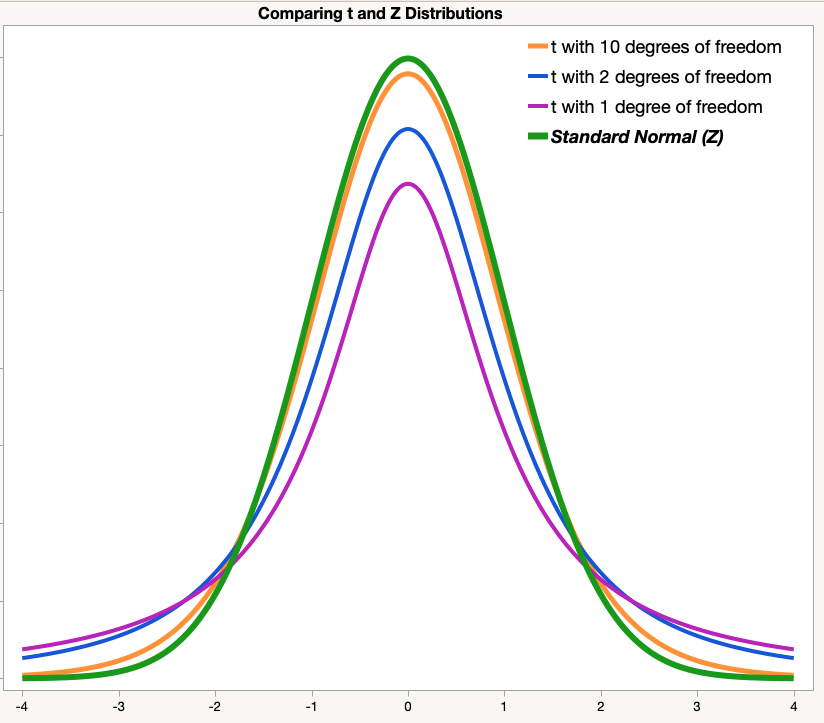
Hence we can conclude that when $n$ is small (less than $30$ ), the shape of the $t$ distribution will be flatter and more spread out when compared to the normal distribution.
Note: In questions of this type we should be sure with the concepts that we are applying in between the steps during the process of answering. This is a pure concept based question and it is clearly derived from the concepts of statistics.
Complete step-by-step answer:
Now considering from the question we have been asked to compare the shape of the $t$ distribution with that of the normal distribution, when $n$ is small (less than $30$ ).
We know that $t$ distribution is a type of probability distribution that is similar to the normal distribution and it has a greater chance for extreme values than normal distribution.
Here a diagram is shown for $t$ distributions of different degrees and normal distribution in a single plot so that we can compare them easily. Observe them carefully and draw the required conclusions.
Hence we can conclude that when $n$ is small (less than $30$ ), the shape of the $t$ distribution will be flatter and more spread out when compared to the normal distribution.
Note: In questions of this type we should be sure with the concepts that we are applying in between the steps during the process of answering. This is a pure concept based question and it is clearly derived from the concepts of statistics.
Recently Updated Pages
Master Class 11 Computer Science: Engaging Questions & Answers for Success
Master Class 11 Business Studies: Engaging Questions & Answers for Success
Master Class 11 Economics: Engaging Questions & Answers for Success
Master Class 11 English: Engaging Questions & Answers for Success
Master Class 11 Maths: Engaging Questions & Answers for Success
Master Class 11 Biology: Engaging Questions & Answers for Success
Trending doubts
One Metric ton is equal to kg A 10000 B 1000 C 100 class 11 physics CBSE
There are 720 permutations of the digits 1 2 3 4 5 class 11 maths CBSE
Discuss the various forms of bacteria class 11 biology CBSE
Draw a diagram of a plant cell and label at least eight class 11 biology CBSE
State the laws of reflection of light
Explain zero factorial class 11 maths CBSE