


How many music directors are required to create (9−10) songs?
(a) 8
(b) 5
(c) 4
(d) 6
Answer
516.6k+ views
Hint: A histogram is an area diagram that can be defined as a set of rectangles with bases along with the intervals between class boundaries and with areas proportional to frequencies in the corresponding classes. The heights of rectangles are proportional to corresponding class frequency if the intervals are equal.. To find the music directors required to create (9−10) songs, we have to look for corresponding Y-axis values.
Complete step by step answer:
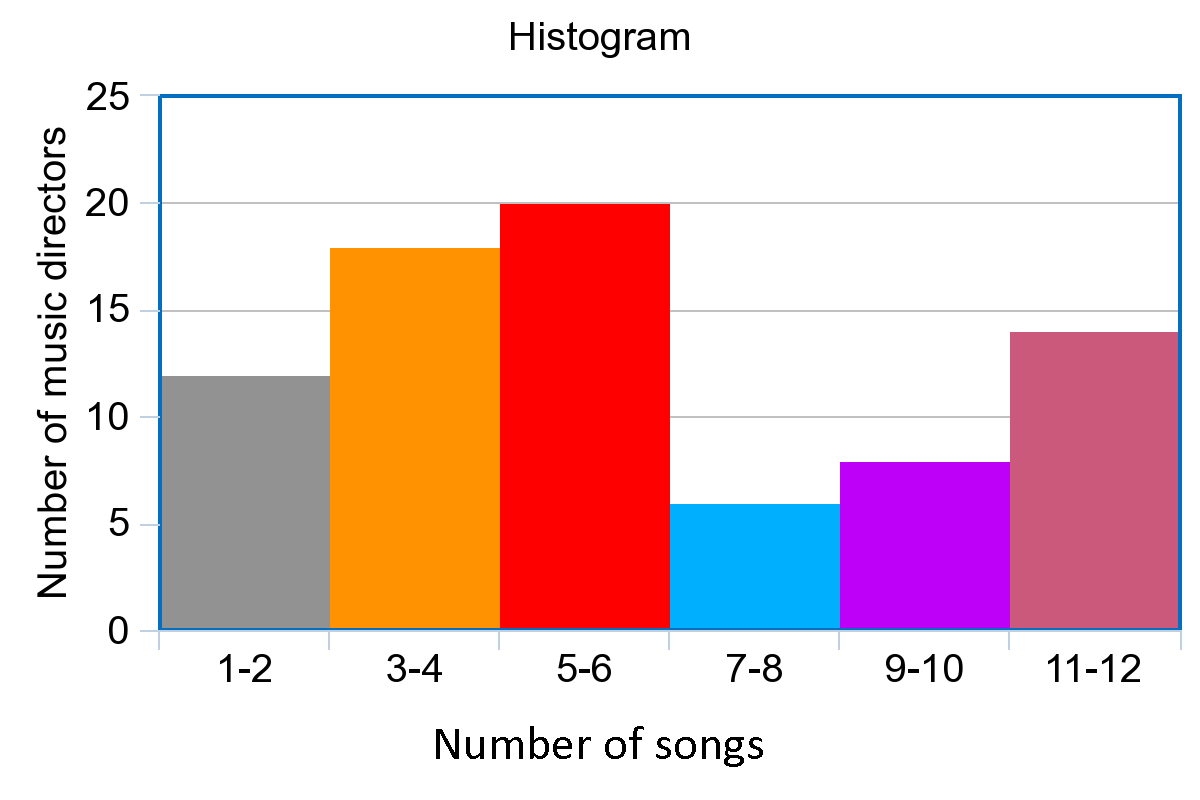
We are given a histogram that shows the number of music directors required for various classes of songs. We have to find the music directors required to create (9−10) songs. Let us recollect what a histogram is and how data are graphed in a histogram. We know that a histogram is a graphical representation of a grouped frequency distribution with continuous classes. A histogram is an area diagram that can be defined as a set of rectangles with bases along with the intervals between class boundaries and with areas proportional to frequencies in the corresponding classes. In a histogram, we can see that all the rectangles are adjacent since the base covers the intervals between class boundaries. We can see from a histogram that the heights of rectangles are proportional to corresponding class frequency if the intervals are equal.
To find the music directors required to create (9−10) songs, we have to look for corresponding Y-axis values. From the given histogram, we can infer that to create (9−10) songs, 8 music directors are required.
So, the correct answer is “Option a”.
Note: Students must read the bar graph carefully as there is a high chance to make mistakes when reading the Y-axis value due to the units of the Y-axis. They must check the units in the Y-axis carefully. Students may get confused with a histogram and a bar chart. In a histogram, the bars touch each other, and we consider class intervals. In a bar chart, bars do not touch each other (but touch in a double bar graph) and we consider only the individual variables. We can see that in a histogram, the area of every individual rectangle is proportional to the corresponding class frequency if the intervals are unequal.
Complete step by step answer:
We are given a histogram that shows the number of music directors required for various classes of songs. We have to find the music directors required to create (9−10) songs. Let us recollect what a histogram is and how data are graphed in a histogram. We know that a histogram is a graphical representation of a grouped frequency distribution with continuous classes. A histogram is an area diagram that can be defined as a set of rectangles with bases along with the intervals between class boundaries and with areas proportional to frequencies in the corresponding classes. In a histogram, we can see that all the rectangles are adjacent since the base covers the intervals between class boundaries. We can see from a histogram that the heights of rectangles are proportional to corresponding class frequency if the intervals are equal.
To find the music directors required to create (9−10) songs, we have to look for corresponding Y-axis values. From the given histogram, we can infer that to create (9−10) songs, 8 music directors are required.
So, the correct answer is “Option a”.
Note: Students must read the bar graph carefully as there is a high chance to make mistakes when reading the Y-axis value due to the units of the Y-axis. They must check the units in the Y-axis carefully. Students may get confused with a histogram and a bar chart. In a histogram, the bars touch each other, and we consider class intervals. In a bar chart, bars do not touch each other (but touch in a double bar graph) and we consider only the individual variables. We can see that in a histogram, the area of every individual rectangle is proportional to the corresponding class frequency if the intervals are unequal.
Recently Updated Pages
Master Class 8 Social Science: Engaging Questions & Answers for Success
Master Class 8 English: Engaging Questions & Answers for Success
Class 8 Question and Answer - Your Ultimate Solutions Guide
Master Class 8 Maths: Engaging Questions & Answers for Success
Master Class 8 Science: Engaging Questions & Answers for Success
Master Class 7 English: Engaging Questions & Answers for Success
Trending doubts
Difference Between Plant Cell and Animal Cell
Fill the blanks with the suitable prepositions 1 The class 9 english CBSE
Who is eligible for RTE class 9 social science CBSE
Which places in India experience sunrise first and class 9 social science CBSE
What is pollution? How many types of pollution? Define it
Name 10 Living and Non living things class 9 biology CBSE