


What is the minimum height possible of the tallest student?
A.170
B.175
C.180
D.165
Answer
639k+ views
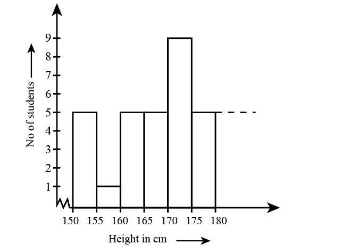
Hint: This question is of statistics. By statistics we mean the collection and interpretation of data. Statistics also involve the organisation of the data in a simpler way. In our problem height of the students and number of students are represented on a graph. We will need to convert this data into the continuous data frequency form so that study of this data becomes easier. We will write the height in the class interval form and then we will write the respective number of students in that class interval. In statistics we can call the number of students as the frequency. Then we will choose the class interval with maximum height of the students.
Complete step-by-step answer:
This question is of statistics. By statistics we mean the collection and interpretation of data. Statistics also involve the organisation of the data in a simpler way. In our problem height of the students and number of students are represented on a graph. We will need to convert this data into the continuous data frequency form so that study of this data becomes easier.
In order to solve this question, we will convert the data given in the graphical form into the continuous data frequency in a tabular form.
From the table, we can see that the tallest students are in the class interval of range 175-180. In this interval the minimum height of the tallest student is $ 175\;{\rm{cm}} $ and the maximum height of the tallest student is \[180\;{\rm{cm}}\].
Hence we can say that the correct answer is option B, that is, the minimum height possible of the tallest student is \[175\;{\rm{cm}}\].
Note: The most important thing in this question is the interpretation of the data from the graph. We will have to read the information given in the questions in the graphical form and then we will interpret the desired information from the graph. The tabular form makes it easier to read the data in the continuous data frequency.
Complete step-by-step answer:
This question is of statistics. By statistics we mean the collection and interpretation of data. Statistics also involve the organisation of the data in a simpler way. In our problem height of the students and number of students are represented on a graph. We will need to convert this data into the continuous data frequency form so that study of this data becomes easier.
In order to solve this question, we will convert the data given in the graphical form into the continuous data frequency in a tabular form.
| Height in cm | Number of students |
| 150-155 | 5 |
| 155-160 | 1 |
| 160-165 | 5 |
| 165-170 | 5 |
| 170-175 | 9 |
| 175-180 | 5 |
From the table, we can see that the tallest students are in the class interval of range 175-180. In this interval the minimum height of the tallest student is $ 175\;{\rm{cm}} $ and the maximum height of the tallest student is \[180\;{\rm{cm}}\].
Hence we can say that the correct answer is option B, that is, the minimum height possible of the tallest student is \[175\;{\rm{cm}}\].
Note: The most important thing in this question is the interpretation of the data from the graph. We will have to read the information given in the questions in the graphical form and then we will interpret the desired information from the graph. The tabular form makes it easier to read the data in the continuous data frequency.

Recently Updated Pages
Basicity of sulphurous acid and sulphuric acid are
Master Class 12 Economics: Engaging Questions & Answers for Success
Master Class 12 Biology: Engaging Questions & Answers for Success
Master Class 11 English: Engaging Questions & Answers for Success
Master Class 11 Physics: Engaging Questions & Answers for Success
Master Class 11 Computer Science: Engaging Questions & Answers for Success
Trending doubts
Difference Between Plant Cell and Animal Cell
Fill the blanks with the suitable prepositions 1 The class 9 english CBSE
What is pollution? How many types of pollution? Define it
What is the full form of pH?
What is the Full Form of ICSE, CBSE and SSC
On an outline map of India show its neighbouring c class 9 social science CBSE