


\[{\text{Maximise }}z{\text{ }} = {\text{ }}x{\text{ }} + {\text{ }}y,{\text{ subject to }}x{\text{ }} - {\text{ }}y{\text{ }} \leqslant {\text{ }} - 1,{\text{ }} - x{\text{ }} + {\text{ }}y{\text{ }} \leqslant {\text{ }}0,{\text{ }}x{\text{ }},{\text{ }}y{\text{ }} \geqslant {\text{ }}0\]
Answer
621.3k+ views
Hint: We can see all the points are present in a X-Y plane. We will plot, these points and mark the area:
For ‘≥’ sign area above the line whereas for ‘≤’ sign area below the line is considered.
To maximise the value, we need to consider the area lying above the same.
Complete step-by-step answer:
According to the question, we have to maximize \[z{\text{ }} = {\text{ }}x{\text{ }} + {\text{ }}y\]
Subjected to:
\[x{\text{ }} - {\text{ }}y{\text{ }} \leqslant {\text{ }} - 1\]
\[ - x{\text{ }} + {\text{ }}y{\text{ }} \leqslant {\text{ }}0\]
\[{\text{ }}x{\text{ }},{\text{ }}y{\text{ }} \geqslant {\text{ }}0\]
For finding the areas to be considered on the graph, we need to plot some points on the graph and these points can be calculated by equating either variable to 0:
For \[x{\text{ }} - {\text{ }}y{\text{ }} \leqslant {\text{ }} - 1:\]:
For \[ - x{\text{ + }}y{\text{ }} \leqslant {\text{ 0:}}\]:
Plotting these values on graph:
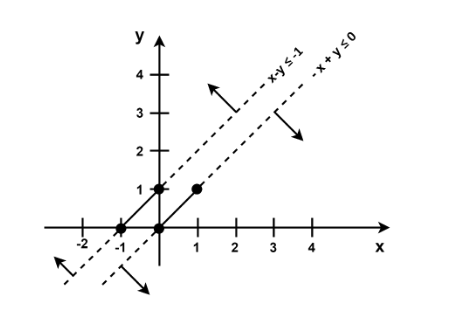
The arrows show the area that is to be considered by each line.
We can observe that there is no common or feasible region between the given lines.
This implies that there is no maximum value of Z.
Note: Feasible region is that region where all the points of subjects and constraints are satisfied.Be careful while taking the area into consideration based upon the signs of inequality present.Instead of colouring and shading the regions, draw arrows (as drawn in figure) for better clarification.
For ‘≥’ sign area above the line whereas for ‘≤’ sign area below the line is considered.
To maximise the value, we need to consider the area lying above the same.
Complete step-by-step answer:
According to the question, we have to maximize \[z{\text{ }} = {\text{ }}x{\text{ }} + {\text{ }}y\]
Subjected to:
\[x{\text{ }} - {\text{ }}y{\text{ }} \leqslant {\text{ }} - 1\]
\[ - x{\text{ }} + {\text{ }}y{\text{ }} \leqslant {\text{ }}0\]
\[{\text{ }}x{\text{ }},{\text{ }}y{\text{ }} \geqslant {\text{ }}0\]
For finding the areas to be considered on the graph, we need to plot some points on the graph and these points can be calculated by equating either variable to 0:
For \[x{\text{ }} - {\text{ }}y{\text{ }} \leqslant {\text{ }} - 1:\]:
| x | 0 | -1 |
| y | 1 | 0 |
For \[ - x{\text{ + }}y{\text{ }} \leqslant {\text{ 0:}}\]:
| x | 0 | 1 |
| y | 0 | 1 |
Plotting these values on graph:
The arrows show the area that is to be considered by each line.
We can observe that there is no common or feasible region between the given lines.
This implies that there is no maximum value of Z.
Note: Feasible region is that region where all the points of subjects and constraints are satisfied.Be careful while taking the area into consideration based upon the signs of inequality present.Instead of colouring and shading the regions, draw arrows (as drawn in figure) for better clarification.

Recently Updated Pages
Master Class 8 English: Engaging Questions & Answers for Success
Master Class 8 Science: Engaging Questions & Answers for Success
Master Class 8 Maths: Engaging Questions & Answers for Success
Class 8 Question and Answer - Your Ultimate Solutions Guide
Master Class 8 Social Science: Engaging Questions & Answers for Success
Master Class 12 Economics: Engaging Questions & Answers for Success
Trending doubts
What is BLO What is the full form of BLO class 8 social science CBSE
Which Indian state shares the longest international class 8 social science CBSE
Citizens of India can vote at the age of A 18 years class 8 social science CBSE
Right to vote is a AFundamental Right BFundamental class 8 social science CBSE
Full form of STD, ISD and PCO
What is the area formula of an obtuse triangle class 8 maths CBSE