


How do you make box – and - whisker plot of the average daily temperatures in Tucson, Arizona, in December: $67,57,52,51,64,58,55,59,66,50,57,62,58,50,58,50,60,63$?
Answer
546.3k+ views
Hint: The problem given above can be solved by sorting out the given data in ascending order and then finding the first quartile median, second quartile median and also the third quartile median by dividing the sorted values over here, after that we can make a box – and – whisker plot upon daily temperature in Tucson and Arizona as given in the problem.
Complete step-by-step answer:
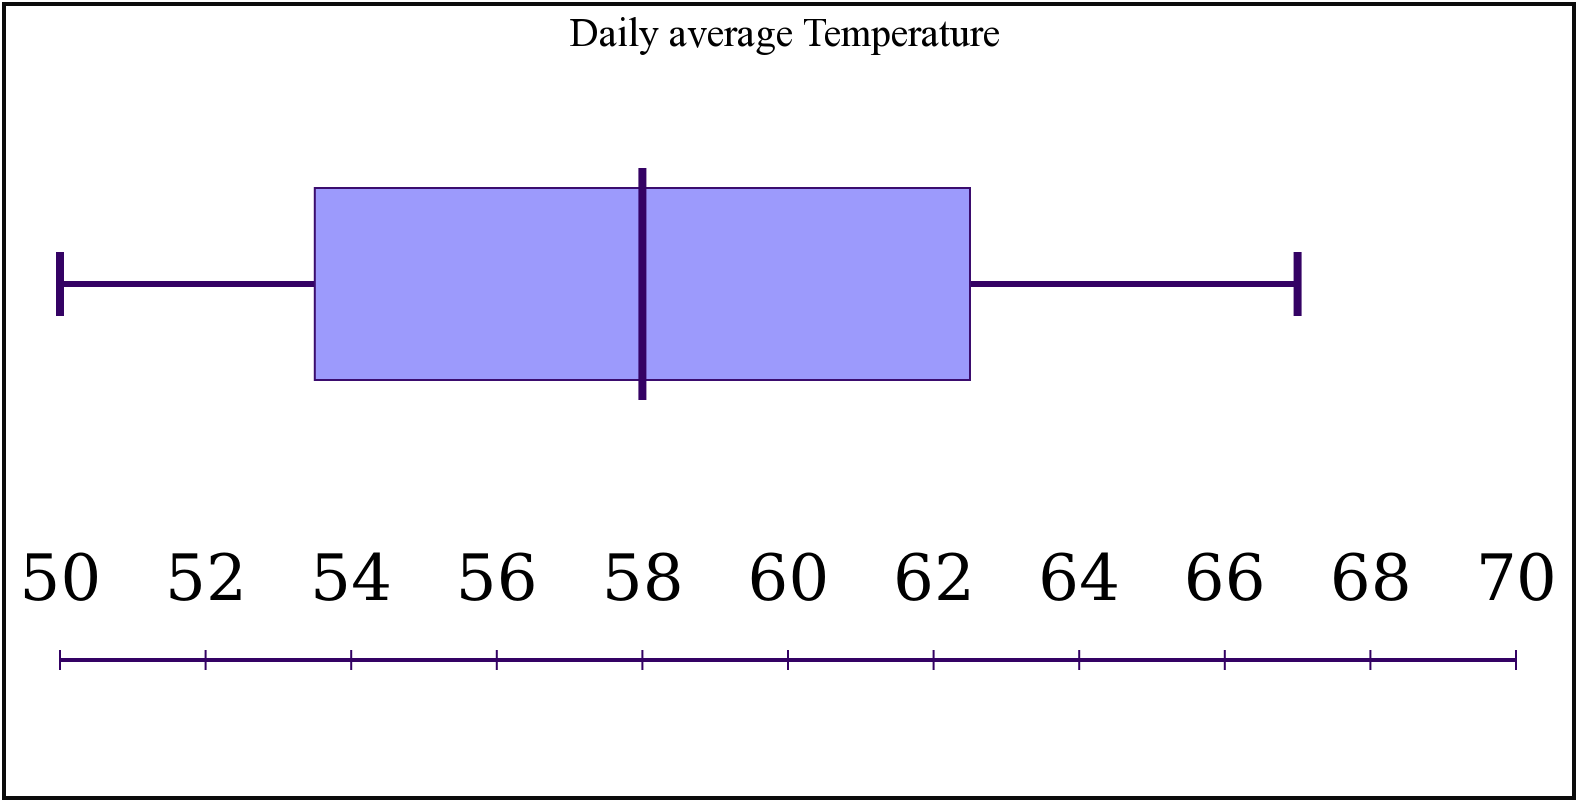
Here first quartile ${{Q}_{1}}$ refers to the median of first half of the data, and second quartile ${{Q}_{2}}$refers to the median of whole sorted data that we have sorted or arranged in ascending order, and the third quartile ${{Q}_{3}}$ refers to the median of the second half sorted data,
First let us sort the given data in ascending order,
Our sorted data is: $\{50,50,50,51,52,55,57,57,58,58,58,58,59,60,62,63,64,66,67,67\}$
First quartile is the median of the first half of the data, i.e. first ten terms:
$\{50,50,50,51,52,55,57,57,58,58\}$
Clearly the first quartile or median of this first half data is ${{Q}_{1}}$=$53.5$
The median of the complete sorted data is the second quartile and that is ${{Q}_{2}}$= $58$
Third quartile is the median of this second half data, i.e. second ten terms:
$\{58,58,59,60,62,63,64,66,67,67\}$
Clearly the third quartile or median of this second half data is ${{Q}_{3}}$= $62.5$
As we have got everything, we can now plot the graph:
Note: To solve this problem one should know about finding median and arranging the data in ascending or descending orders. Plotting the analyzed data with care has its own importance in this problem.
Complete step-by-step answer:
Here first quartile ${{Q}_{1}}$ refers to the median of first half of the data, and second quartile ${{Q}_{2}}$refers to the median of whole sorted data that we have sorted or arranged in ascending order, and the third quartile ${{Q}_{3}}$ refers to the median of the second half sorted data,
First let us sort the given data in ascending order,
Our sorted data is: $\{50,50,50,51,52,55,57,57,58,58,58,58,59,60,62,63,64,66,67,67\}$
First quartile is the median of the first half of the data, i.e. first ten terms:
$\{50,50,50,51,52,55,57,57,58,58\}$
Clearly the first quartile or median of this first half data is ${{Q}_{1}}$=$53.5$
The median of the complete sorted data is the second quartile and that is ${{Q}_{2}}$= $58$
Third quartile is the median of this second half data, i.e. second ten terms:
$\{58,58,59,60,62,63,64,66,67,67\}$
Clearly the third quartile or median of this second half data is ${{Q}_{3}}$= $62.5$
As we have got everything, we can now plot the graph:
Note: To solve this problem one should know about finding median and arranging the data in ascending or descending orders. Plotting the analyzed data with care has its own importance in this problem.
Recently Updated Pages
Master Class 11 Business Studies: Engaging Questions & Answers for Success
Master Class 11 Economics: Engaging Questions & Answers for Success
Master Class 11 Computer Science: Engaging Questions & Answers for Success
Master Class 11 English: Engaging Questions & Answers for Success
Master Class 11 Maths: Engaging Questions & Answers for Success
Master Class 11 Biology: Engaging Questions & Answers for Success
Trending doubts
One Metric ton is equal to kg A 10000 B 1000 C 100 class 11 physics CBSE
Discuss the various forms of bacteria class 11 biology CBSE
Draw a diagram of a plant cell and label at least eight class 11 biology CBSE
State the laws of reflection of light
Explain zero factorial class 11 maths CBSE
10 examples of friction in our daily life