


How do you make a table to graph $y = 1500 \cdot {365^{1.68x}}$ ?
Answer
540k+ views
Hint: As given in the question $y = 1500 \cdot {365^{1.68x}}$ , this function represent the relationship between the input variable that is $x$ and the output variable that is $y$ . Here we have exactly one output for every input. We can get the table by assuming an input variable then find the output variables corresponding to that input variable. Input variable is also known as independent variable as well as domain of the function. Output variable is also known as dependent variable as well as range of the function.
Complete step by step answer:
We have $y = 1500 \cdot {365^{1.68x}}$
Now, for finding the value of dependent variable ,
Setting independent variable, $x = 0,1,2,3,4.....$
$y = 1500 \cdot {365^{1.68x}} = 1500$ (for $x = 0$ )
We have $(0,1500)$
$y = 1500 \cdot {365^{1.68}} = 30251.25$ (for $x = 1$ )
We have $(1,30251.25)$
$y = 1500 \cdot {365^{1.68 \cdot (2)}} = 610091.93$ (for $x = 2$ )
We have $(2,0.25)$
Similarly, we can find further…
Therefore , the required table is ,
Therefore the graph will look like following:
Note: Functions are usually represented by a function rule where you express the variable, $y$ , in terms of the variable, $x$ . Here $y$ is dependent on $x$ . A pair of an input value and its corresponding output value is named an ordered pair and may be written as $(a,b)$. In an ordered pair the primary number, the input $a$, corresponds to the horizontal axis and also the second number, the output $b$, corresponds to the vertical axis.
A pairing of any set of inputs with their corresponding outputs is termed a relation. Every function may be a relation, but not all relations are functions.
Complete step by step answer:
We have $y = 1500 \cdot {365^{1.68x}}$
Now, for finding the value of dependent variable ,
Setting independent variable, $x = 0,1,2,3,4.....$
$y = 1500 \cdot {365^{1.68x}} = 1500$ (for $x = 0$ )
We have $(0,1500)$
$y = 1500 \cdot {365^{1.68}} = 30251.25$ (for $x = 1$ )
We have $(1,30251.25)$
$y = 1500 \cdot {365^{1.68 \cdot (2)}} = 610091.93$ (for $x = 2$ )
We have $(2,0.25)$
Similarly, we can find further…
Therefore , the required table is ,
| x | y = F(x) |
| 0 | 1500 |
| 1 | 30251.25 |
| 2 | 610091.93 |
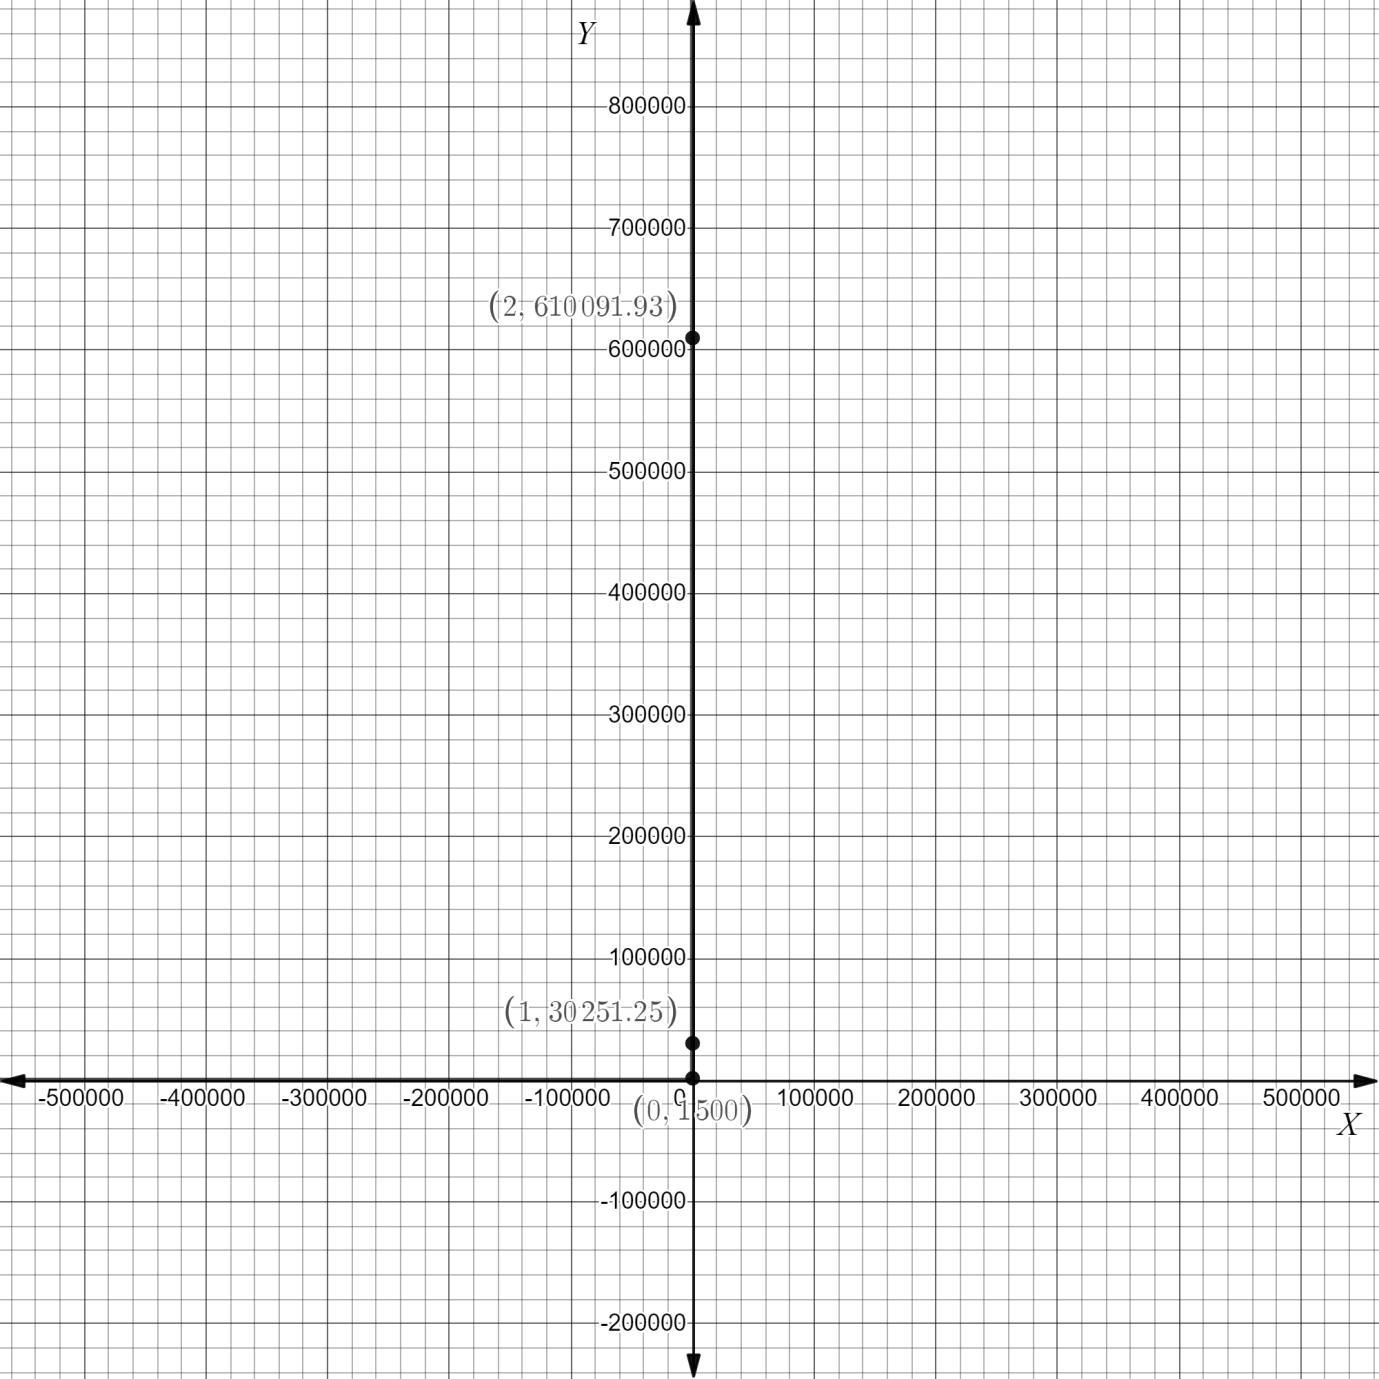
Therefore the graph will look like following:
Note: Functions are usually represented by a function rule where you express the variable, $y$ , in terms of the variable, $x$ . Here $y$ is dependent on $x$ . A pair of an input value and its corresponding output value is named an ordered pair and may be written as $(a,b)$. In an ordered pair the primary number, the input $a$, corresponds to the horizontal axis and also the second number, the output $b$, corresponds to the vertical axis.
A pairing of any set of inputs with their corresponding outputs is termed a relation. Every function may be a relation, but not all relations are functions.
Recently Updated Pages
Master Class 10 Computer Science: Engaging Questions & Answers for Success
Master Class 10 General Knowledge: Engaging Questions & Answers for Success
Master Class 10 English: Engaging Questions & Answers for Success
Master Class 10 Social Science: Engaging Questions & Answers for Success
Master Class 10 Maths: Engaging Questions & Answers for Success
Master Class 10 Science: Engaging Questions & Answers for Success
Trending doubts
What is the median of the first 10 natural numbers class 10 maths CBSE
Which women's tennis player has 24 Grand Slam singles titles?
Who is the Brand Ambassador of Incredible India?
Why is there a time difference of about 5 hours between class 10 social science CBSE
Write a letter to the principal requesting him to grant class 10 english CBSE
A moving boat is observed from the top of a 150 m high class 10 maths CBSE