


Make a graph of $f\left( x \right)=x+\left[ x \right]$.
Answer
508.5k+ views
Hint: we will make use of the properties of the greatest integer function to plot the given graph. We will draw the graph of the function by considering a few rational numbers and then obtaining the value of f(x) for those x and then we will get our answer.
Complete step by step answer:
Before starting the sum, we need to understand how functions of this type work. Basically the meaning of the graph function $f\left( x \right)=x+\left[ x \right]$.
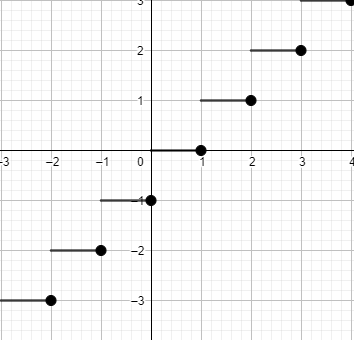
We know that greatest integer of x is always represented as $\left[ x \right]$, and it has a property that if we put some rational number as the value of x then we obtain the value of $\left[ x \right]$ as the integer less than or equal to x. So we get the curve of $\left[ x \right]$as
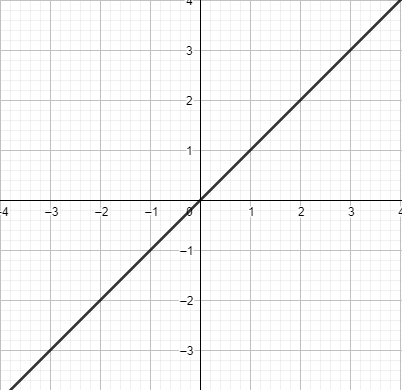
Now, we will draw the graph of x and then we will combinedly draw the graph of f(x).
Now, when we will calculate the values of f(x), we will get
For x = 1
f(1) = 1+1=2
For x = 1.5
f(1.5) = 1.5+1=2.5
For x = 3.7
f(3.7) = 3.7+3=6.7
For x = -2.5
f(2.5) = -2.5+(-3)=-5.5
Therefore, we get the graph of the function as
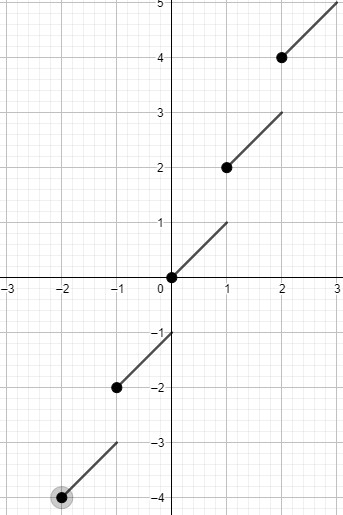
So, this is the graph of $y=f\left( x \right)=x+\left[ x \right]$.
Note: A modulus function is a function that will always yield a positive output. Make sure to plot the points exactly in accordance with the values obtained. And check all the values of x and y by putting them into the equation. And then plot the points on the graph and make this.
Complete step by step answer:
Before starting the sum, we need to understand how functions of this type work. Basically the meaning of the graph function $f\left( x \right)=x+\left[ x \right]$.
We know that greatest integer of x is always represented as $\left[ x \right]$, and it has a property that if we put some rational number as the value of x then we obtain the value of $\left[ x \right]$ as the integer less than or equal to x. So we get the curve of $\left[ x \right]$as
Now, we will draw the graph of x and then we will combinedly draw the graph of f(x).
Now, when we will calculate the values of f(x), we will get
For x = 1
f(1) = 1+1=2
For x = 1.5
f(1.5) = 1.5+1=2.5
For x = 3.7
f(3.7) = 3.7+3=6.7
For x = -2.5
f(2.5) = -2.5+(-3)=-5.5
Therefore, we get the graph of the function as
So, this is the graph of $y=f\left( x \right)=x+\left[ x \right]$.
Note: A modulus function is a function that will always yield a positive output. Make sure to plot the points exactly in accordance with the values obtained. And check all the values of x and y by putting them into the equation. And then plot the points on the graph and make this.
Recently Updated Pages
Master Class 12 English: Engaging Questions & Answers for Success
Master Class 12 Social Science: Engaging Questions & Answers for Success
Master Class 12 Maths: Engaging Questions & Answers for Success
Master Class 12 Economics: Engaging Questions & Answers for Success
Master Class 12 Physics: Engaging Questions & Answers for Success
Master Class 12 Business Studies: Engaging Questions & Answers for Success
Trending doubts
Which are the Top 10 Largest Countries of the World?
What are the major means of transport Explain each class 12 social science CBSE
Draw a labelled sketch of the human eye class 12 physics CBSE
Differentiate between insitu conservation and exsitu class 12 biology CBSE
Draw a neat and well labeled diagram of TS of ovary class 12 biology CBSE
RNA and DNA are chiral molecules their chirality is class 12 chemistry CBSE