


How do you make a box and whisker plot from the data: 48, 60, 40, 68, 51, 47, 57, 41, 65, 61, 20, 65, 49, 34, 63, 53, 52, 35, 45, 35, 65, 65, 48, 36, 24, 53, 64, 48, 40 ?
Answer
562.2k+ views
Hint: To solve this number initially we have to arrange the given number in ascending order. And then find the median of these numbers. Then, take the lower half and find the median of that; draw a vertical line over a number line on that value. Then find the median of the top half and draw another vertical line. Connect the tops and bottoms of the lines. Now you have your box, To finish, plot your smallest value and connect that with a line and plot the largest point and connect that with another line.
Complete step-by-step answer:
A Box and Whisker Plot (or Box Plot) is a convenient way of visually displaying the data distribution through their quartiles.
Let’s first order the numbers in ascending order.
20, 24, 34, 35, 35, 36, 40, 40, 41, 45, 47, 48, 48, 48, 49, 51, 52, 53, 53, 57, 60, 61, 63, 64, 65, 65, 65, 65, 68.
So, the median of the numbers is \[{{15}^{th}}\] term, that is 49
Then, take the lower half and find the median of that,
Median of 20, 24, 34, 35, 35, 36, 40, 40, 41, 45, 47, 48, 48 and 48 is average of \[{{7}^{th}}\] and \[{{8}^{th}}\] term,
\[\Rightarrow \dfrac{40+40}{2}=\dfrac{80}{2}=40\]
Then let’s find the median of the top half,
Median of 51, 52, 53, 53, 57, 60, 61, 63, 64, 65, 65, 65, 65 and 68 is average of \[{{7}^{th}}\] and \[{{8}^{th}}\] term,
\[\Rightarrow \dfrac{61+63}{2}=\dfrac{124}{2}=62\]
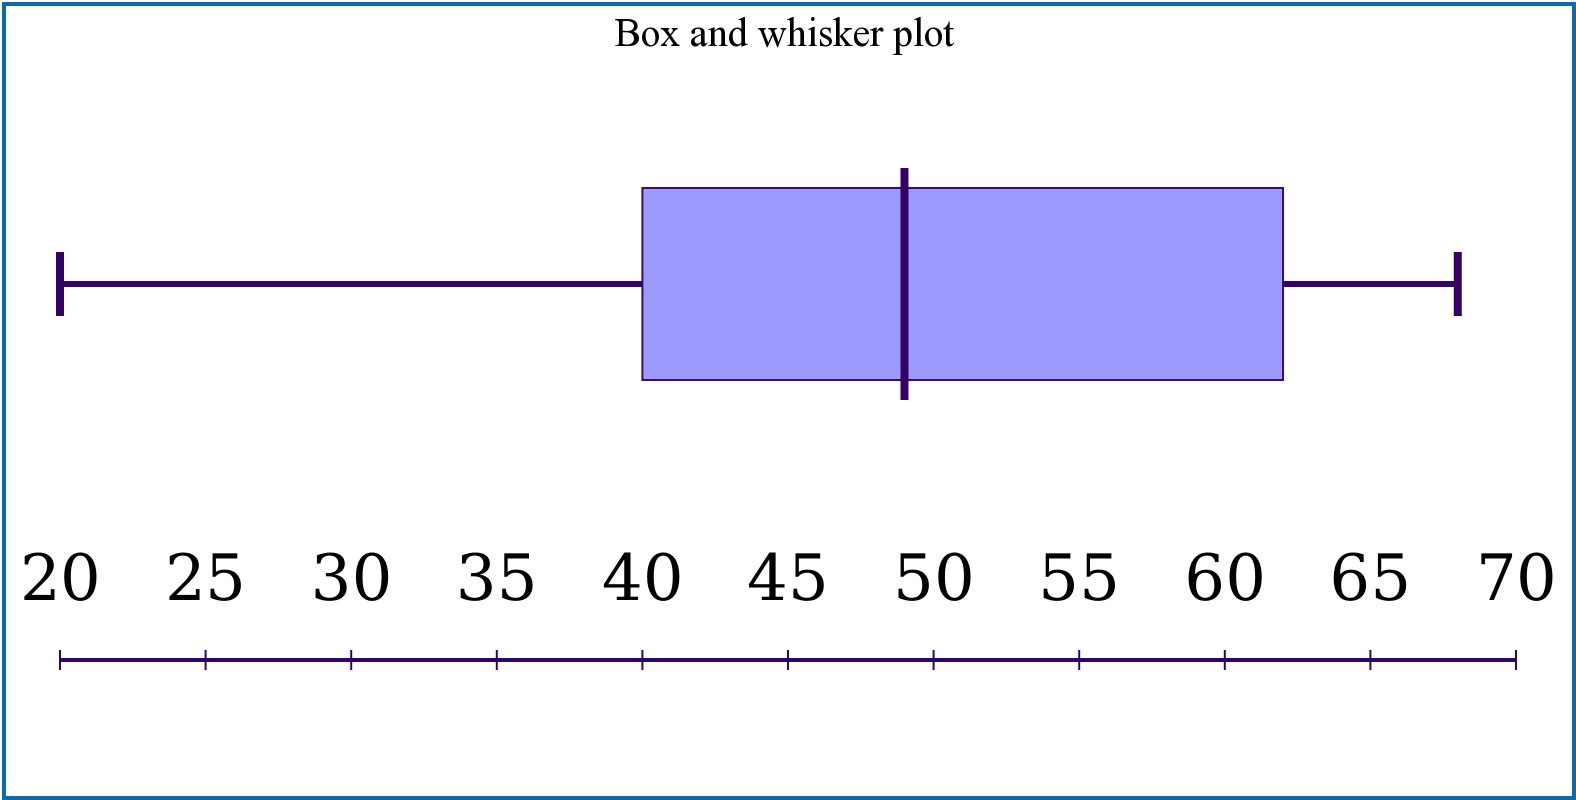
Now plot that point on the graph and draw a vertical line. Then draw a vertical line over a number line on median of lower half value and median of top half value. Connect the tops and bottoms of the lines. Now you now have your box.
To finish, plot your smallest value and connect that with a line and plot the largest point and connect that with another line.
Note: Students can usually go wrong in taking the median of the given numbers as missing any number will lead to faulty answers and he/she should be aware of drawing Box and Whisker plots.
Complete step-by-step answer:
A Box and Whisker Plot (or Box Plot) is a convenient way of visually displaying the data distribution through their quartiles.
Let’s first order the numbers in ascending order.
20, 24, 34, 35, 35, 36, 40, 40, 41, 45, 47, 48, 48, 48, 49, 51, 52, 53, 53, 57, 60, 61, 63, 64, 65, 65, 65, 65, 68.
So, the median of the numbers is \[{{15}^{th}}\] term, that is 49
Then, take the lower half and find the median of that,
Median of 20, 24, 34, 35, 35, 36, 40, 40, 41, 45, 47, 48, 48 and 48 is average of \[{{7}^{th}}\] and \[{{8}^{th}}\] term,
\[\Rightarrow \dfrac{40+40}{2}=\dfrac{80}{2}=40\]
Then let’s find the median of the top half,
Median of 51, 52, 53, 53, 57, 60, 61, 63, 64, 65, 65, 65, 65 and 68 is average of \[{{7}^{th}}\] and \[{{8}^{th}}\] term,
\[\Rightarrow \dfrac{61+63}{2}=\dfrac{124}{2}=62\]
Now plot that point on the graph and draw a vertical line. Then draw a vertical line over a number line on median of lower half value and median of top half value. Connect the tops and bottoms of the lines. Now you now have your box.
To finish, plot your smallest value and connect that with a line and plot the largest point and connect that with another line.
Note: Students can usually go wrong in taking the median of the given numbers as missing any number will lead to faulty answers and he/she should be aware of drawing Box and Whisker plots.
Recently Updated Pages
Master Class 11 Social Science: Engaging Questions & Answers for Success
Master Class 11 Physics: Engaging Questions & Answers for Success
Master Class 11 Maths: Engaging Questions & Answers for Success
Master Class 11 Economics: Engaging Questions & Answers for Success
Master Class 11 Computer Science: Engaging Questions & Answers for Success
Master Class 11 Chemistry: Engaging Questions & Answers for Success
Trending doubts
One Metric ton is equal to kg A 10000 B 1000 C 100 class 11 physics CBSE
How many bones are in the spine class 11 biology CBSE
1 Quintal is equal to a 110 kg b 10 kg c 100kg d 1000 class 11 physics CBSE
There are 720 permutations of the digits 1 2 3 4 5 class 11 maths CBSE
State and prove Bernoullis theorem class 11 physics CBSE
Difference Between Prokaryotic Cells and Eukaryotic Cells