


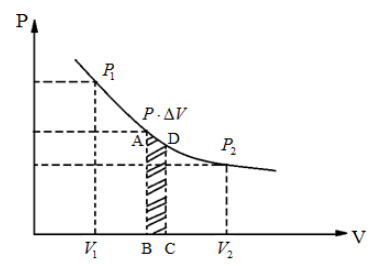
Look at the indicator diagram and answer the following questions:
(i) Which thermodynamic process does it possibly represent?
(ii) How much work is done when the volume of the working substance changes from ${V_1}$ to ${V_2}$?
Answer
600.3k+ views
Hint: In this question, we need to comment on the thermodynamic process involved in the given figure and evaluate the work done when the volume of the working substance changes from ${V_1}$ to ${V_2}$. For this, we will observe the given plot carefully and try to relate the different thermodynamic process with the given figure.
Complete step by step answer:
The graph of two variables $x$ and $y$ will be a rectangular hyperbola if the product $x.y$ is always constant. It is known that the temperature is constant in an isothermal thermodynamic process.
In the above figure, the graph plotted between the pressure $P$ and the volume $V$ is in hyperbolic nature. Which means, the product $P.V$ is constant. From the formula $P.V = nRT$, we can say that the right hand side of the equation, $nRT$ is constant as the left hand side is also a constant. As the number of moles $n$ and the universal gas constant $R$ which is equal to $8.314J$/$mol$ are both constants, it can be said that the temperature $T$ is also constant. Hence, the above indicator diagram represents an isothermal thermodynamic process.
Consider that in an isothermal process, the pressure and volume of the ideal gas changes from $({P_1},{V_1})$ to $({P_2},{V_2})$ . Somewhere in the middle of the process where the pressure is $P$ and volume changes from $V$ to $V + \Delta V$, $\Delta V$ being infinitesimally small. From the first law of thermodynamics $\Delta W = P\Delta V$, $\Delta V \to 0$ as it is infinitesimally small and summing $\Delta W$ over entire process, we get total work done by the gas as
$W = \int\limits_{{V_1}}^{{V_2}} {PdV} $ where limits of integration goes from ${V_1}$ to ${V_2}$. Using the formula $PV = nRT$, we get $P = \dfrac{{nRT}}{V}$
$ \Rightarrow W = \int\limits_{{V_1}}^{{V_2}} {\left( {\dfrac{{nRT}}{V}} \right)dV} $
On integrating the above equation, we get
\[W = nRT\ln \left( {\dfrac{{{V_2}}}{{{V_1}}}} \right)\] and as we know that $\ln = {\log _e}$, this can be written as
$W = 2.303nRT\log \left( {\dfrac{{{V_2}}}{{{V_1}}}} \right)$
Note: The formula $PV = nRT$ is used where $P$ is pressure, $V$ is volume, $n$ is the number of moles, $R$ is the universal gas constant and $T$ is the temperature. First law of thermodynamics: $\Delta W = P\Delta V$ where $\Delta W$ is the change in work done, $P$ is the pressure and $\Delta V$ is the change in volume. The work done can also be expressed in terms of initial pressure ${P_1}$ and final pressure ${P_2}$ as $W = 2.303nRT\log \left( {\dfrac{{{P_1}}}{{{P_2}}}} \right)$.
Recently Updated Pages
Master Class 12 Economics: Engaging Questions & Answers for Success
Master Class 12 English: Engaging Questions & Answers for Success
Master Class 12 Social Science: Engaging Questions & Answers for Success
Master Class 12 Maths: Engaging Questions & Answers for Success
Master Class 12 Physics: Engaging Questions & Answers for Success
Master Class 9 General Knowledge: Engaging Questions & Answers for Success
Trending doubts
One Metric ton is equal to kg A 10000 B 1000 C 100 class 11 physics CBSE
Difference Between Prokaryotic Cells and Eukaryotic Cells
Two of the body parts which do not appear in MRI are class 11 biology CBSE
1 ton equals to A 100 kg B 1000 kg C 10 kg D 10000 class 11 physics CBSE
Draw a diagram of nephron and explain its structur class 11 biology CBSE
10 examples of friction in our daily life