


Information collected from 150 students about their parent’s occupations is given below. Make a pictograph based on it.
Occupations of Students Parents Number of students Farming 60 Private Job 20 Government 30 Other 40
| Occupations of Students Parents | Number of students |
| Farming | 60 |
| Private Job | 20 |
| Government | 30 |
| Other | 40 |
Answer
621.3k+ views
Hint: We start solving this question by first understanding what a pictograph means and what we use it for. Then we use the information given and consider a diagram or figure and assume that it represents 10 students. Then we represent each category with the diagrams we assumed as the number of students of that category.
Complete step by step answer:
First let us go through the definition of Pictorial representation.
Pictures and figures are made in pictograph to represent the collected data. We represent the numerical data using pictures in the Pictograph. We use them to make the representations clear and for quick understanding. In the pictographs we use the same picture to represent the number of objects.
A pictograph has a title and labelled. It helps us to compare between two types just by taking a look at the figures.
Number of students whose parent’s occupation is farming is 60.
Number of students whose parent’s occupation is a private job is 20.
Number of students whose parent’s occupation is government is 30.
Number of students whose parents occupation other than given above is 40.
Now let us consider the diagram below.

Let us say that it is equal to 10 students. Then we can give our pictograph as 60 students is equal to 6 figures, 20 students is equal to 2 figures, 30 students is equal to 3 figures and 40 students is equal to 4 figures.
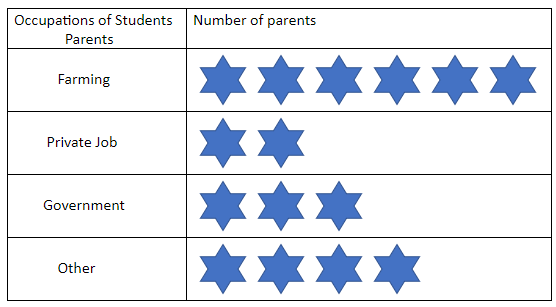
So, the above table is our pictograph.
Note: The common mistake that one does while making pictographs is one might use different diagrams or figures to represent different categories in the pictograph. For example, while making a pictograph for the above question one might use different figures for farming, private job, government and other occupations.
Complete step by step answer:
First let us go through the definition of Pictorial representation.
Pictures and figures are made in pictograph to represent the collected data. We represent the numerical data using pictures in the Pictograph. We use them to make the representations clear and for quick understanding. In the pictographs we use the same picture to represent the number of objects.
A pictograph has a title and labelled. It helps us to compare between two types just by taking a look at the figures.
Number of students whose parent’s occupation is farming is 60.
Number of students whose parent’s occupation is a private job is 20.
Number of students whose parent’s occupation is government is 30.
Number of students whose parents occupation other than given above is 40.
Now let us consider the diagram below.
Let us say that it is equal to 10 students. Then we can give our pictograph as 60 students is equal to 6 figures, 20 students is equal to 2 figures, 30 students is equal to 3 figures and 40 students is equal to 4 figures.
So, the above table is our pictograph.
Note: The common mistake that one does while making pictographs is one might use different diagrams or figures to represent different categories in the pictograph. For example, while making a pictograph for the above question one might use different figures for farming, private job, government and other occupations.
Recently Updated Pages
Master Class 8 English: Engaging Questions & Answers for Success
Master Class 8 Science: Engaging Questions & Answers for Success
Master Class 8 Maths: Engaging Questions & Answers for Success
Class 8 Question and Answer - Your Ultimate Solutions Guide
Master Class 8 Social Science: Engaging Questions & Answers for Success
Master Class 12 Economics: Engaging Questions & Answers for Success
Trending doubts
What is BLO What is the full form of BLO class 8 social science CBSE
Which Indian state shares the longest international class 8 social science CBSE
Citizens of India can vote at the age of A 18 years class 8 social science CBSE
Right to vote is a AFundamental Right BFundamental class 8 social science CBSE
Full form of STD, ISD and PCO
What is the area formula of an obtuse triangle class 8 maths CBSE