


In which game, the maximum number of students took part?
A. Running
B. Shot-put
C. Long jump
D. None of these
Answer
566.7k+ views
Hint: Here represented the data in a graphical way, or presented it graphically which is called as the graphical representation, which refers to visually displaying and analyzing with the use of charts and graphs, which is also used to interpret numerical data. Here used a pie chart which is also called a circle graph, as it is a circular statistical graph, which is divided into pies (called slices) to illustrate the numerical proportion of the data.
Complete step-by-step solution:
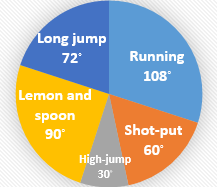
Given the pie-chart is divided into 5 categories which are Running, shot-put, high-jump, lemon and spoon, and long jump.
Here given that each of the categories which are games, have been displayed by the angle occupied by each category of the game.
The whole angle of the circle is ${360^ \circ }$.
As the total no. of students is not mentioned,
Let the total no. of students = $x$
Then the no. of students who are playing that particular game can be obtained by the ratio of the angle occupied by that particular game to the total angle of the circle which is ${360^ \circ }$multiplied with the total no. of students.
The no. of students who took part in running:
$ \Rightarrow \dfrac{{{{108}^ \circ }}}{{{{360}^ \circ }}} \times x = 0.3x$
$\therefore 0.3x$students took part in running.
The no. of students who played shot-put:
$ \Rightarrow \dfrac{{{{60}^ \circ }}}{{{{360}^ \circ }}} \times x = 0.16x$
$\therefore 0.16x$students played shot-put.
The no. of students who played high jump:
$ \Rightarrow \dfrac{{{{30}^ \circ }}}{{{{360}^ \circ }}} \times x = 0.08x$
$\therefore 0.08x$students played high jump.
The no. of students who played lemon and spoon:
$ \Rightarrow \dfrac{{{{90}^ \circ }}}{{{{360}^ \circ }}} \times x = 0.25x$
$\therefore 0.25x$students played lemon and spoon.
The no. of students who played long jump:
$ \Rightarrow \dfrac{{{{72}^ \circ }}}{{{{360}^ \circ }}} \times x = 0.2x$
$\therefore 0.2x$ students played long jump.
Maximum no. of students took part in running.
Note: The data can be represented in any graphical format but pie charts are the best for displaying data for around 6 categories or lower.
Complete step-by-step solution:
Given the pie-chart is divided into 5 categories which are Running, shot-put, high-jump, lemon and spoon, and long jump.
Here given that each of the categories which are games, have been displayed by the angle occupied by each category of the game.
The whole angle of the circle is ${360^ \circ }$.
As the total no. of students is not mentioned,
Let the total no. of students = $x$
Then the no. of students who are playing that particular game can be obtained by the ratio of the angle occupied by that particular game to the total angle of the circle which is ${360^ \circ }$multiplied with the total no. of students.
The no. of students who took part in running:
$ \Rightarrow \dfrac{{{{108}^ \circ }}}{{{{360}^ \circ }}} \times x = 0.3x$
$\therefore 0.3x$students took part in running.
The no. of students who played shot-put:
$ \Rightarrow \dfrac{{{{60}^ \circ }}}{{{{360}^ \circ }}} \times x = 0.16x$
$\therefore 0.16x$students played shot-put.
The no. of students who played high jump:
$ \Rightarrow \dfrac{{{{30}^ \circ }}}{{{{360}^ \circ }}} \times x = 0.08x$
$\therefore 0.08x$students played high jump.
The no. of students who played lemon and spoon:
$ \Rightarrow \dfrac{{{{90}^ \circ }}}{{{{360}^ \circ }}} \times x = 0.25x$
$\therefore 0.25x$students played lemon and spoon.
The no. of students who played long jump:
$ \Rightarrow \dfrac{{{{72}^ \circ }}}{{{{360}^ \circ }}} \times x = 0.2x$
$\therefore 0.2x$ students played long jump.
Maximum no. of students took part in running.
Note: The data can be represented in any graphical format but pie charts are the best for displaying data for around 6 categories or lower.
Recently Updated Pages
Master Class 11 Computer Science: Engaging Questions & Answers for Success
Master Class 11 Business Studies: Engaging Questions & Answers for Success
Master Class 11 Economics: Engaging Questions & Answers for Success
Master Class 11 English: Engaging Questions & Answers for Success
Master Class 11 Maths: Engaging Questions & Answers for Success
Master Class 11 Biology: Engaging Questions & Answers for Success
Trending doubts
One Metric ton is equal to kg A 10000 B 1000 C 100 class 11 physics CBSE
There are 720 permutations of the digits 1 2 3 4 5 class 11 maths CBSE
Discuss the various forms of bacteria class 11 biology CBSE
Draw a diagram of a plant cell and label at least eight class 11 biology CBSE
State the laws of reflection of light
Explain zero factorial class 11 maths CBSE