


In Trapezoid rule, the curve $y=f\left( x \right)$ between two successive ordinates is approximated as
(a) straight line
(b) parabola
(c) cubic parabola
(d) arc of a circle
Answer
589.2k+ views
Hint: We will look at the definition of the trapezoid rule. We will understand the working of this rule using a rough diagram. We will look at what we achieve by using the trapezoidal rule. We will see the approximation between the two ordinates from the diagram. After that, we will be able to select the correct option from the choices given.
Complete step by step answer:
The trapezoid rule is a rule used in the integration. Integration is basically computing the area under the curve represented by a function. Now, in the trapezoid rule, the area under the curve of a function is divided into trapezoids instead of rectangles. The following figure represents some curve $y=f\left( x \right)$. The dashed lines are the trapezoids which approximate the region under the curve. So, the area under the curve can be calculated by calculating the area covered by all the trapezoids approximating the region.
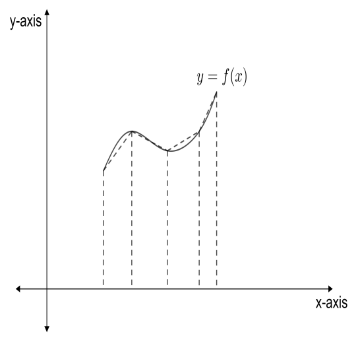
If we keep making the subintervals smaller and smaller, the area calculated using the trapezoidal rule will become more and more accurate. The ordinate is the y-coordinate of a point. So, successive ordinates represent the value of the function at successive inputs.
From the figure, we can conclude that the non-parallel sides of the trapezoid join the successive ordinates and the successive inputs. These non-parallel sides are straight lines. Hence, the curve between the successive ordinates is approximated by a straight line. Therefore, the correct option is (a).
Note:
It is important to understand the concept of integration. Like the trapezoid rule, there are other rules that can be used for computing integrals. Simpson's rule is one of these rules. We also have the Riemann integration, where we approximate the region under the curve using upper and lower rectangles.
Complete step by step answer:
The trapezoid rule is a rule used in the integration. Integration is basically computing the area under the curve represented by a function. Now, in the trapezoid rule, the area under the curve of a function is divided into trapezoids instead of rectangles. The following figure represents some curve $y=f\left( x \right)$. The dashed lines are the trapezoids which approximate the region under the curve. So, the area under the curve can be calculated by calculating the area covered by all the trapezoids approximating the region.
If we keep making the subintervals smaller and smaller, the area calculated using the trapezoidal rule will become more and more accurate. The ordinate is the y-coordinate of a point. So, successive ordinates represent the value of the function at successive inputs.
From the figure, we can conclude that the non-parallel sides of the trapezoid join the successive ordinates and the successive inputs. These non-parallel sides are straight lines. Hence, the curve between the successive ordinates is approximated by a straight line. Therefore, the correct option is (a).
Note:
It is important to understand the concept of integration. Like the trapezoid rule, there are other rules that can be used for computing integrals. Simpson's rule is one of these rules. We also have the Riemann integration, where we approximate the region under the curve using upper and lower rectangles.
Recently Updated Pages
Master Class 12 Business Studies: Engaging Questions & Answers for Success
Master Class 12 Biology: Engaging Questions & Answers for Success
Master Class 12 Chemistry: Engaging Questions & Answers for Success
Class 12 Question and Answer - Your Ultimate Solutions Guide
Master Class 11 Social Science: Engaging Questions & Answers for Success
Master Class 11 English: Engaging Questions & Answers for Success
Trending doubts
Explain the Treaty of Vienna of 1815 class 10 social science CBSE
Which Indian city is known as the "City of Victory"?
Which instrument is used to measure the Blood Pressure?
Who Won 36 Oscar Awards? Record Holder Revealed
What is the median of the first 10 natural numbers class 10 maths CBSE
Why is it 530 pm in india when it is 1200 afternoon class 10 social science CBSE