


In sigmoid curve, upper asymptote represents period of
A) Establishment
B) Negative acceleration
C) Positive acceleration
D) Equilibrium
Answer
591.3k+ views
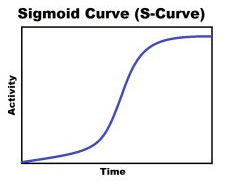
Hint: The upper limit of the sigmoid curve is known as upper asymptote. This is representing the period of equilibrium. Sigmoid curve is also known as S-shaped growth curve. The point of stabilization, or zero growth rates, is termed the saturation value (symbolized by K) or carrying capacity of the environment for that organism.
Complete step-by-step answer:
The growth curve of any organism appears to have a sigmoid or S- shaped curve which comprises lag phase, log phase, stationary phase and death phase. The lag phase is the adaptation phase for the organism where they adapted themselves to the new environmental conditions provided. At this stage the growth is slow. While, in the log phase is the logarithmic growth phase in which the growth of an organism is exponential and rapid.
They are completely adaptable and they multiply or grow using food or nutrients being available and finally they stop dividing at stationary phase. It could be due to various reasons: exhaustion of nutrients, ageing of the cells, inability of the cells to reach their maximum potential etc.
Finally, at decline or the death phase this is the stage at which the death of an organism occurs. The upper limit represents the period of the equilibrium. This is said to be at equilibrium because at this stage, there is equilibrium between biotic potential and environmental resistance. This is the plateau stage when the population remains stable with time. Here the birth rate is equal to the death rate i.e. mortality rate is equal to the natality rate.
Hence, the correct answer is option ‘D’ i.e, equilibrium.
Note: In sigmoid curve, upper asymptote limits representing equilibrium. Here the population of animals will be stable. It is usually summarized mathematically by the logistic equation. In which, K represents the upper asymptote of the sigmoidal or S-shaped curve produced when changing population numbers are plotted over time.
Recently Updated Pages
Master Class 12 Business Studies: Engaging Questions & Answers for Success
Master Class 12 Biology: Engaging Questions & Answers for Success
Master Class 12 Chemistry: Engaging Questions & Answers for Success
Class 12 Question and Answer - Your Ultimate Solutions Guide
Master Class 11 Social Science: Engaging Questions & Answers for Success
Master Class 11 English: Engaging Questions & Answers for Success
Trending doubts
Which is more stable and why class 12 chemistry CBSE
Which are the Top 10 Largest Countries of the World?
Draw a labelled sketch of the human eye class 12 physics CBSE
Differentiate between homogeneous and heterogeneous class 12 chemistry CBSE
What are the major means of transport Explain each class 12 social science CBSE
Sulphuric acid is known as the king of acids State class 12 chemistry CBSE