


In histogram, the height of the rectangle shows __________.
A.Width of the class
B.Upper limit of the class
C.Lower limit of the class
D.Frequency of the class
Answer
492k+ views
Hint: Generally, a histogram is a graphical representation of data that uses bars to show the frequency of numerical data and the bar contains length and height. Here, we are asked to answer what the height of the rectangle or bar denotes.
Complete step by step answer:
A histogram is generally a graph that shows the data using bars to provide the frequency of numerical data.
The below figure is an example of a histogram.
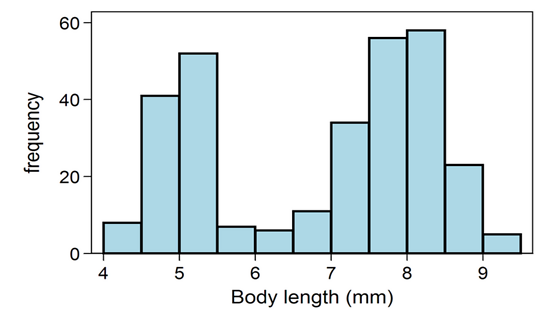
Hence, a histogram is a graphical representation in the form of rectangles, the width of the rectangle shows the class intervals and the height of the rectangle denotes the frequency. Also, there will be no gap between any successive rectangles.
Now, consider a class containing thirty students. Twelve students participated in the essay competition, ten students participated in the painting competition and five students participated in the drawing competition. If we are asked to find the number of students who participated in the painting competition, we are able to answer that ten students participated in the painting competition. The number of students in particular observation is called the frequency.
We need to count the number of times the event occurred in a set of data. That counting will be the required frequency. Using frequency, we will create a table called the frequency distribution table.
Thus, the number of times a particular observation occurs is called frequency. We can write the frequency for the grouped data and ungrouped data.
In the histogram, we usually denote the frequency for class intervals
Hence, the height of the bar or rectangle in histogram denotes the number of times a particular observation occurs called the frequency of class.
Note:
First, we need to know the difference between histogram and bar graph since both graphs use bars for representation. A bar graph uses bars to compare different categories of data whereas a histogram uses bars to show the frequency of data. Also, bars touch each other containing no space between bars in a histogram, but bars do not touch each other in a bar graph.
Complete step by step answer:
A histogram is generally a graph that shows the data using bars to provide the frequency of numerical data.
The below figure is an example of a histogram.
Hence, a histogram is a graphical representation in the form of rectangles, the width of the rectangle shows the class intervals and the height of the rectangle denotes the frequency. Also, there will be no gap between any successive rectangles.
Now, consider a class containing thirty students. Twelve students participated in the essay competition, ten students participated in the painting competition and five students participated in the drawing competition. If we are asked to find the number of students who participated in the painting competition, we are able to answer that ten students participated in the painting competition. The number of students in particular observation is called the frequency.
We need to count the number of times the event occurred in a set of data. That counting will be the required frequency. Using frequency, we will create a table called the frequency distribution table.
Thus, the number of times a particular observation occurs is called frequency. We can write the frequency for the grouped data and ungrouped data.
In the histogram, we usually denote the frequency for class intervals
Hence, the height of the bar or rectangle in histogram denotes the number of times a particular observation occurs called the frequency of class.
Note:
First, we need to know the difference between histogram and bar graph since both graphs use bars for representation. A bar graph uses bars to compare different categories of data whereas a histogram uses bars to show the frequency of data. Also, bars touch each other containing no space between bars in a histogram, but bars do not touch each other in a bar graph.
Recently Updated Pages
Master Class 10 Computer Science: Engaging Questions & Answers for Success
Master Class 10 General Knowledge: Engaging Questions & Answers for Success
Master Class 10 English: Engaging Questions & Answers for Success
Master Class 10 Social Science: Engaging Questions & Answers for Success
Master Class 10 Maths: Engaging Questions & Answers for Success
Master Class 10 Science: Engaging Questions & Answers for Success
Trending doubts
Explain the Treaty of Vienna of 1815 class 10 social science CBSE
Who Won 36 Oscar Awards? Record Holder Revealed
What is the median of the first 10 natural numbers class 10 maths CBSE
Why is it 530 pm in india when it is 1200 afternoon class 10 social science CBSE
Select the word that is correctly spelled a Twelveth class 10 english CBSE
Why is there a time difference of about 5 hours between class 10 social science CBSE