


In ECG, P-wave represents
A) Ventricular repolarization
B) Ventricular depolarization
C) Atrial depolarization
D) Atrial repolarization
Answer
625.8k+ views
Hint:ECG stands for Electrocardiogram, which records the heart signals with the help of electrodes placed on the body of a patient.
Complete answer:
ECG:-
>It records the electrical signal from the heart in order to check heart condition.
>It is a painless test.
>It is a graphical representation showing waves
>Electrodes are placed on the chest of the patient to record his/her heart condition.
>The signals are shown in a monitor or computer attached with the ECG machine.
Waves of ECG:-
The ECG include:
1) P Wave
2) Q Wave
3) S Wave
4) R Wave
5) U Wave
6) T Wave
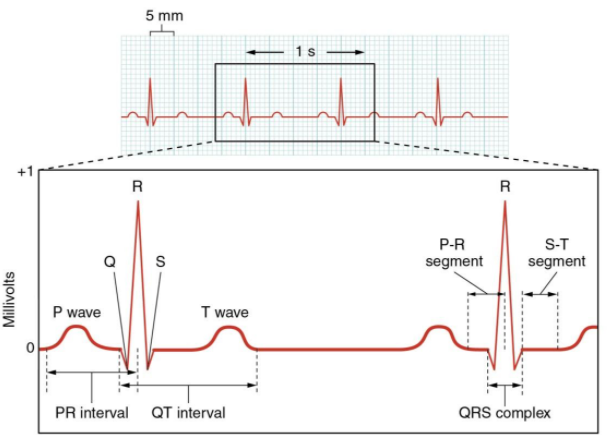
P- Wave:-
In ECG, the P-Wave represents Atrial depolarization. This Atrial depolarization results in atrial contraction or atrial systole.
Q- Wave:-
In ECG, the Q- Wave represents Ventricular depolarization. The Q Wave is an initially negative deflection of the QRS complex.
S- Wave:-
In ECG, the S-Wave signifies the Ventricular depolarization. The S wave is the first downward deflection of QRS complex occurs after the R wave.
R- Wave:-
In ECG, the R-Wave represents the Ventricular depolarization. It is the first positive wave of the QRS complex.
U- Wave:-
U wave represents the ventricular repolarization. This wave comes after the T wave.
T- Wave:-
T waves represent the ventricular repolarization. The T wave comes after the QRS complex.
Therefore, from the above discussion it is clear that in ECG, the P- wave represents Atrial depolarization.
Hence option “C” is the correct answer.
Note:Remember to keep in mind that there is no distinct wave for atrial repolarization so don’t get confused with it. All the waves in the QRS complex show ventricular depolarization.
Complete answer:
ECG:-
>It records the electrical signal from the heart in order to check heart condition.
>It is a painless test.
>It is a graphical representation showing waves
>Electrodes are placed on the chest of the patient to record his/her heart condition.
>The signals are shown in a monitor or computer attached with the ECG machine.
Waves of ECG:-
The ECG include:
1) P Wave
2) Q Wave
3) S Wave
4) R Wave
5) U Wave
6) T Wave
P- Wave:-
In ECG, the P-Wave represents Atrial depolarization. This Atrial depolarization results in atrial contraction or atrial systole.
Q- Wave:-
In ECG, the Q- Wave represents Ventricular depolarization. The Q Wave is an initially negative deflection of the QRS complex.
S- Wave:-
In ECG, the S-Wave signifies the Ventricular depolarization. The S wave is the first downward deflection of QRS complex occurs after the R wave.
R- Wave:-
In ECG, the R-Wave represents the Ventricular depolarization. It is the first positive wave of the QRS complex.
U- Wave:-
U wave represents the ventricular repolarization. This wave comes after the T wave.
T- Wave:-
T waves represent the ventricular repolarization. The T wave comes after the QRS complex.
Therefore, from the above discussion it is clear that in ECG, the P- wave represents Atrial depolarization.
Hence option “C” is the correct answer.
Note:Remember to keep in mind that there is no distinct wave for atrial repolarization so don’t get confused with it. All the waves in the QRS complex show ventricular depolarization.
Recently Updated Pages
Master Class 12 Business Studies: Engaging Questions & Answers for Success
Master Class 12 Chemistry: Engaging Questions & Answers for Success
Master Class 12 Biology: Engaging Questions & Answers for Success
Class 12 Question and Answer - Your Ultimate Solutions Guide
Master Class 11 English: Engaging Questions & Answers for Success
Master Class 11 Social Science: Engaging Questions & Answers for Success
Trending doubts
Which are the Top 10 Largest Countries of the World?
Draw a labelled sketch of the human eye class 12 physics CBSE
Differentiate between homogeneous and heterogeneous class 12 chemistry CBSE
Differentiate between Pyramid of energy and pyramid class 12 biology CBSE
Why is the cell called the structural and functional class 12 biology CBSE
Draw the diagram of the pyramid of energy Explain In class 12 biology CBSE