


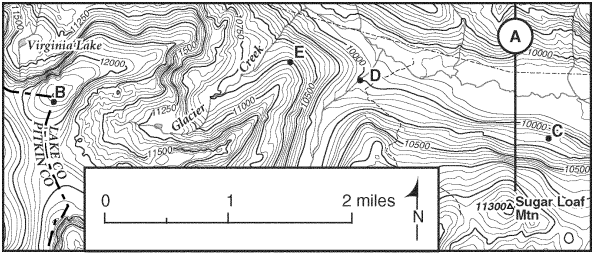
In above Figure, what is the contour interval of the map?
A. 25 feet
B. 10 feet
C. 50 feet
D. 100 feet
Answer
559.2k+ views
Hint:
1. A curve along which the function has a constant value is a contour line of a function of two variables, such that the curve joins equal-value points. It is a plane segment parallel to the plane of the three-dimensional graph of the f-function.
2. A contour map is a map illustrated with contour lines, such as a topographical map showing valleys and hills and the steepness or gentleness of slopes, for example. A contour map's contour interval is the difference between successive contour lines in elevation.
Complete solution:
The vertical difference between the two contour lines perpendicular to each other is the contour interval.
The contour interval in the specified figure is 50 feet. As follows, it is determined:
Let us take an example of two labelled contour lines.
At 10,000 elevation, point D is labelled and the next label is labelled as 10,500 elevation.
10.500-10000=500 feet
There are 10 counter lines between these two contour lines if we count.
500/10=50
That means there is a gap of 50 feet for each counter side.
As follows, we should cross-check it:
50 * 10 (as there are 10 lines of contour between 10,500 and 10000 marked points) = 500 feet.
Option A is not the correct answer because the contour interval of the map is not 25 feet.
Option B is not the correct answer because the contour interval of the map is not 10 feet.
Option C is the correct answer because the contour interval of the map is 50 feet.
Option D is not the correct answer because the contour interval of the map is not 100 feet.
Hence, the correct answer is option C.
Note:
1. Contour line, a line on a map reflecting an imaginary line on the surface of the earth, all points of which are above a date plane at the same elevation, typically meaning sea level. Map: Lines of contours. By joining points of equal elevation, the diagram shows how contour lines show relief.
2. A map is a symbolic representation that emphasises relationships, such as objects, regions, or themes, between elements of a certain space.
Recently Updated Pages
Master Class 11 Computer Science: Engaging Questions & Answers for Success
Master Class 11 Business Studies: Engaging Questions & Answers for Success
Master Class 11 Economics: Engaging Questions & Answers for Success
Master Class 11 English: Engaging Questions & Answers for Success
Master Class 11 Maths: Engaging Questions & Answers for Success
Master Class 11 Biology: Engaging Questions & Answers for Success
Trending doubts
One Metric ton is equal to kg A 10000 B 1000 C 100 class 11 physics CBSE
There are 720 permutations of the digits 1 2 3 4 5 class 11 maths CBSE
Discuss the various forms of bacteria class 11 biology CBSE
Draw a diagram of a plant cell and label at least eight class 11 biology CBSE
State the laws of reflection of light
Explain zero factorial class 11 maths CBSE