


In a University, out of 100 students 15 offered Mathematics only; 12 offered statistics only; 8 offered only physics; 40 offered Physics and Mathematics; 20 offered Physics and statistics; 10 offered Mathematics and Statistics; 65 offered Physics. By drawing a Venn diagram, find the number of students who (1) offered Mathematics (2) offered Statistics (3) did not offer any of the above three subjects.
Answer
550.5k+ views
Hint: At first consider the number of students who offered all the three subjects as ‘x’. Now, by the conditions given and data given, find the value of x and then find the other questions which are asked.
Complete step-by-step answer:
In the given question we are said that in a University, out of 100 students, 15 offered Mathematics only; 12 offered Statistics only; 8 offered only physics; 40 offered Physics and Mathematics; 20 offered Physics and statistics; 10 offered Mathematics and Statistics; 65 offered Physics. So, there are three questions. On the 1st we are asked to find how many students offered Mathematics, in the 2nd question we are asked to find the number of students who offered statistics and in the last question we are asked how many offer none of the three subjects mentioned.
So, let’s represents number of students who offered Mathematics, Physics and Statistics as $n\left( M \right)$ , $n\left( P \right)$ and $n\left( S \right)$ respectively, both maths and physics as $n\left( M\cap P \right)$ , both physics and statistics as $n\left( P\cap S \right)$ and both mathematics and statistics as $n\left( M\cap S \right)$ all the three subjects as $n\left( M\cap P\cap S \right)$ , only Mathematics as $n\left( \text{M only} \right)$ , only physics $n\left( P\text{ only} \right)$ and only statistics as $n\left( \text{S only} \right)$ .
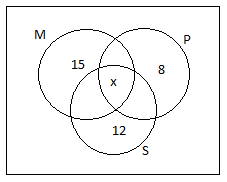
Let the number of students common to subjects be ‘x’ so we can say that, $n\left( M\cap P\cap S \right)=x$.
Hence, we can also write,
$\begin{align}
& n\left( \text{M only} \right)=15 \\
& n\left( \text{P only} \right)=8 \\
& n\left( \text{S only} \right)=12 \\
& n\left( \text{P}\cap \text{M} \right)=40 \\
& n\left( M\cap S \right)=10 \\
& n\left( \text{P}\cap S \right)=20 \\
& n\left( \text{P} \right)=65 \\
\end{align}$
Let’s represent it as a diagram.
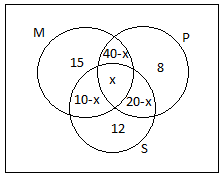
The values of $n\left( M\cap P \right)$, $n\left( M\cap S \right)$, and $n\left( P\cap S \right)$also includes value of $n\left( M\cap P\cap S \right)$. So the value of $n\left( M\cap P \right)$but not S is $\left( 40-x \right)$ , $n\left( M\cap S \right)$ but not P is $\left( 10-x \right)$ and $n\left( P\cap S \right)$but not M is $\left( 20-x \right)$ .
So, the diagram becomes,
Now, we are given that the total number of students who offered Physics is 65. So, $n\left( P \right)=65$ .
$n\left( P \right)$ on term of x will be $n\left( P \right)==\left( 40-x \right)+x+\left( 20-x \right)+8$ or
$n\left( P \right)=68-x$
So, we can say that,
$65=68-x$ .
Hence the value of x is 3.
So we will draw the diagram as,
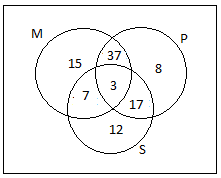
i) So, by the Venn diagram total number of students who offered maths are $15+37+3+7=62$
ii) The total number of students who offered statistics are $12+7+3+17=39$
iii) The total number of students are 100 so the number of students who were offered one of the subjects are $100-\left( 15+37+7+3+8+17+12 \right)=1$
Hence, the numbers of students are 62, 39, and 1 respectively.
Note: Students generally get confused between Mathematics and only mathematics, physics and only physics, statistics and statistics only. Actually the number of students who offer Mathematics means people can read only mathematics or mathematics and physics or mathematics and statistics. The same goes for the other two subjects.
Complete step-by-step answer:
In the given question we are said that in a University, out of 100 students, 15 offered Mathematics only; 12 offered Statistics only; 8 offered only physics; 40 offered Physics and Mathematics; 20 offered Physics and statistics; 10 offered Mathematics and Statistics; 65 offered Physics. So, there are three questions. On the 1st we are asked to find how many students offered Mathematics, in the 2nd question we are asked to find the number of students who offered statistics and in the last question we are asked how many offer none of the three subjects mentioned.
So, let’s represents number of students who offered Mathematics, Physics and Statistics as $n\left( M \right)$ , $n\left( P \right)$ and $n\left( S \right)$ respectively, both maths and physics as $n\left( M\cap P \right)$ , both physics and statistics as $n\left( P\cap S \right)$ and both mathematics and statistics as $n\left( M\cap S \right)$ all the three subjects as $n\left( M\cap P\cap S \right)$ , only Mathematics as $n\left( \text{M only} \right)$ , only physics $n\left( P\text{ only} \right)$ and only statistics as $n\left( \text{S only} \right)$ .
Let the number of students common to subjects be ‘x’ so we can say that, $n\left( M\cap P\cap S \right)=x$.
Hence, we can also write,
$\begin{align}
& n\left( \text{M only} \right)=15 \\
& n\left( \text{P only} \right)=8 \\
& n\left( \text{S only} \right)=12 \\
& n\left( \text{P}\cap \text{M} \right)=40 \\
& n\left( M\cap S \right)=10 \\
& n\left( \text{P}\cap S \right)=20 \\
& n\left( \text{P} \right)=65 \\
\end{align}$
Let’s represent it as a diagram.
The values of $n\left( M\cap P \right)$, $n\left( M\cap S \right)$, and $n\left( P\cap S \right)$also includes value of $n\left( M\cap P\cap S \right)$. So the value of $n\left( M\cap P \right)$but not S is $\left( 40-x \right)$ , $n\left( M\cap S \right)$ but not P is $\left( 10-x \right)$ and $n\left( P\cap S \right)$but not M is $\left( 20-x \right)$ .
So, the diagram becomes,
Now, we are given that the total number of students who offered Physics is 65. So, $n\left( P \right)=65$ .
$n\left( P \right)$ on term of x will be $n\left( P \right)==\left( 40-x \right)+x+\left( 20-x \right)+8$ or
$n\left( P \right)=68-x$
So, we can say that,
$65=68-x$ .
Hence the value of x is 3.
So we will draw the diagram as,
i) So, by the Venn diagram total number of students who offered maths are $15+37+3+7=62$
ii) The total number of students who offered statistics are $12+7+3+17=39$
iii) The total number of students are 100 so the number of students who were offered one of the subjects are $100-\left( 15+37+7+3+8+17+12 \right)=1$
Hence, the numbers of students are 62, 39, and 1 respectively.
Note: Students generally get confused between Mathematics and only mathematics, physics and only physics, statistics and statistics only. Actually the number of students who offer Mathematics means people can read only mathematics or mathematics and physics or mathematics and statistics. The same goes for the other two subjects.
Recently Updated Pages
Master Class 11 Social Science: Engaging Questions & Answers for Success
Master Class 11 English: Engaging Questions & Answers for Success
Master Class 11 Maths: Engaging Questions & Answers for Success
Master Class 11 Chemistry: Engaging Questions & Answers for Success
Master Class 11 Biology: Engaging Questions & Answers for Success
Master Class 11 Physics: Engaging Questions & Answers for Success
Trending doubts
Differentiate between an exothermic and an endothermic class 11 chemistry CBSE
One Metric ton is equal to kg A 10000 B 1000 C 100 class 11 physics CBSE
Difference Between Prokaryotic Cells and Eukaryotic Cells
There are 720 permutations of the digits 1 2 3 4 5 class 11 maths CBSE
Draw a diagram of a plant cell and label at least eight class 11 biology CBSE
Which chemical is known as king of chemicals A H 2 class 11 chemistry CBSE