


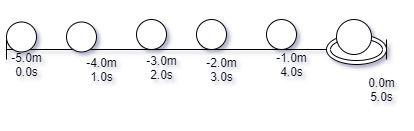
In a golf tournament, if we designate the hole as the origin, and the putter ( like a bat) is at $ - 5.0\;{\text{m}} $ at time $ 0\;{\text{s}} $ , the velocity-time graph will be
(A) A straight line inclined to the time axis
(B) A straight line parallel to the time axis
(C) A concave curve
(D) A convex curve
Answer
579.6k+ views
Hint
The displacement time graph gives the velocity of the body. And the velocity time graph gives the acceleration of the body. So calculate the velocity of the ball.
Complete step by step answer
The position of the golf ball at interval of time is given in the figure. The change in position is the displacement of the golf ball. Here the positions are marked at an interval of $ 1\;{\text{s}} $ .
Here, the golf ball moves in equal distances in an equal interval of time. Thus the golf ball is in uniform velocity.
Let’s take the initial position as $ {s_1} = - 3\;{\text{m}} $ and the final position as $ {s_2} = - 2\;{\text{m}} $ . The time when the golf ball is in $ {s_1} $ is $ {t_1} = 2\;{\text{s}} $ . The time when the golf ball is in $ {s_2} $ is $ {t_2} = 3\;{\text{s}} $ .
The expression for velocity is given as,
$ v = \dfrac{{{s_2} - {s_1}}}{{{t_2} - {t_1}}} $
Substituting the values in the above expression,
$ v = \dfrac{{ - 2\;{\text{m}} - \left( { - 3\;{\text{m}}} \right)}}{{3\;{\text{s}} - 2\;{\text{s}}}} $
$ = 1\;{\text{m/s}} $
Thus the velocity will be $ 1\;{\text{m/s}} $ .
And this velocity is the same for all the positions in each interval of time. Therefore the golf ball is in uniform velocity.
The acceleration is given as the change in velocity per time. The velocity time graph gives acceleration.
Therefore, the expression for acceleration is given as,
$ a = \dfrac{v}{t} $
Where, $ v $ is the velocity and $ t $ is the time.
Here, the velocity in each interval of time is $ 1\;{\text{m/s}} $ . Therefore when we plot the time on X-axis and velocity on Y- axis, for each value of time, the Y- axis will mark the same $ 1\;{\text{m/s}} $ . As the time changes the velocity does not change. So the graph will be a straight line parallel to the X- axis where the time is marked. It will look something like the graph given below.
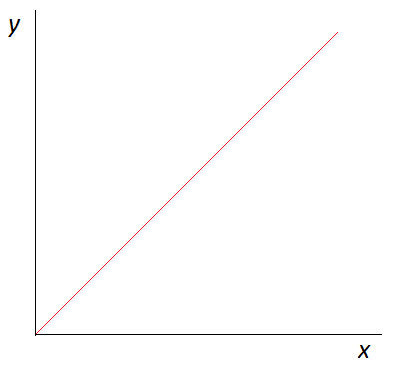
The answer is option (B).
Note
We have to note that for uniform velocity, the velocity time graph will be a straight line parallel to the X- axis. And for uniform acceleration the graph will have a straight line inclined to the time axis.
The displacement time graph gives the velocity of the body. And the velocity time graph gives the acceleration of the body. So calculate the velocity of the ball.
Complete step by step answer
The position of the golf ball at interval of time is given in the figure. The change in position is the displacement of the golf ball. Here the positions are marked at an interval of $ 1\;{\text{s}} $ .
Here, the golf ball moves in equal distances in an equal interval of time. Thus the golf ball is in uniform velocity.
Let’s take the initial position as $ {s_1} = - 3\;{\text{m}} $ and the final position as $ {s_2} = - 2\;{\text{m}} $ . The time when the golf ball is in $ {s_1} $ is $ {t_1} = 2\;{\text{s}} $ . The time when the golf ball is in $ {s_2} $ is $ {t_2} = 3\;{\text{s}} $ .
The expression for velocity is given as,
$ v = \dfrac{{{s_2} - {s_1}}}{{{t_2} - {t_1}}} $
Substituting the values in the above expression,
$ v = \dfrac{{ - 2\;{\text{m}} - \left( { - 3\;{\text{m}}} \right)}}{{3\;{\text{s}} - 2\;{\text{s}}}} $
$ = 1\;{\text{m/s}} $
Thus the velocity will be $ 1\;{\text{m/s}} $ .
And this velocity is the same for all the positions in each interval of time. Therefore the golf ball is in uniform velocity.
The acceleration is given as the change in velocity per time. The velocity time graph gives acceleration.
Therefore, the expression for acceleration is given as,
$ a = \dfrac{v}{t} $
Where, $ v $ is the velocity and $ t $ is the time.
Here, the velocity in each interval of time is $ 1\;{\text{m/s}} $ . Therefore when we plot the time on X-axis and velocity on Y- axis, for each value of time, the Y- axis will mark the same $ 1\;{\text{m/s}} $ . As the time changes the velocity does not change. So the graph will be a straight line parallel to the X- axis where the time is marked. It will look something like the graph given below.
The answer is option (B).
Note
We have to note that for uniform velocity, the velocity time graph will be a straight line parallel to the X- axis. And for uniform acceleration the graph will have a straight line inclined to the time axis.
Recently Updated Pages
Master Class 11 Computer Science: Engaging Questions & Answers for Success
Master Class 11 Business Studies: Engaging Questions & Answers for Success
Master Class 11 Economics: Engaging Questions & Answers for Success
Master Class 11 English: Engaging Questions & Answers for Success
Master Class 11 Maths: Engaging Questions & Answers for Success
Master Class 11 Biology: Engaging Questions & Answers for Success
Trending doubts
One Metric ton is equal to kg A 10000 B 1000 C 100 class 11 physics CBSE
There are 720 permutations of the digits 1 2 3 4 5 class 11 maths CBSE
Discuss the various forms of bacteria class 11 biology CBSE
Draw a diagram of a plant cell and label at least eight class 11 biology CBSE
State the laws of reflection of light
Explain zero factorial class 11 maths CBSE