


In a distance-time graph, which of the following is plotted on the x-axis?
A. Speed
B. Distance
C. Time
D. None
Answer
542.1k+ views
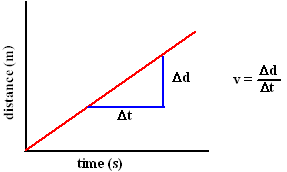
Hint:A distance-time graph can be used to illustrate the distance travelled by an item moving in a straight line. The gradient of the line in a distance-time graph is equal to the object's speed. The quicker the item moves, the higher the gradient (and the steeper the line).
Complete step-by-step solution:
A distance-time graph can be used to illustrate the distance travelled by an item moving in a straight line. The gradient of the line in a distance-time graph is equal to the object's speed. The quicker the item moves, the higher the gradient (and the steeper the line).
While travelling, the distance you traverse and the time it takes to reach that distance are always on your mind. The faster your car moves, the faster you will complete your journey. The concepts of speed, distance, and time are all intertwined. We'll look at the relationship between the three in this section, and we'll also show you how to make a Distance Time graph. A distance-time graph depicts the distance travelled by an item in a given amount of time. It's a straightforward line graph that depicts distance versus time findings. The Y-axis represents distance. The X-axis represents time.
The separation time graph is a line graph that shows the relationship between distance and time. It's easy to make a distance-time graph. To do so, start by drawing two perpendicular lines on a sheet of graph paper that meet at O. The X-axis is the horizontal line, while the Y-axis is the vertical line. We record the amounts or readings of our observation on these axes. Let's look at some observations from a moving car: When examining the motion of bodies, we use the distance-time graph. When we record distance and time for a body's motion and plot the same data on a rectangle graph, we get a distance-time graph that corresponds to that body's motion.
Hence option C is correct.
Note:Now, when we build a graph, we can put our data on any axis; in this case, we used the x-axis to represent distance and the y-axis to represent time. Point O is a zero (o), which represents our starting point. We don't observe that the line, when combined with our various observations, is a slant line anywhere. This demonstrates that the speed remains constant during the journey.
Recently Updated Pages
Master Class 12 Economics: Engaging Questions & Answers for Success
Master Class 12 English: Engaging Questions & Answers for Success
Master Class 12 Social Science: Engaging Questions & Answers for Success
Master Class 12 Maths: Engaging Questions & Answers for Success
Master Class 12 Physics: Engaging Questions & Answers for Success
Master Class 9 General Knowledge: Engaging Questions & Answers for Success
Trending doubts
One Metric ton is equal to kg A 10000 B 1000 C 100 class 11 physics CBSE
Difference Between Prokaryotic Cells and Eukaryotic Cells
Two of the body parts which do not appear in MRI are class 11 biology CBSE
1 ton equals to A 100 kg B 1000 kg C 10 kg D 10000 class 11 physics CBSE
10 examples of friction in our daily life
DNA is not present in A Nucleus B Mitochondria C Chloroplast class 11 biology CBSE