


In a class of 200 students who appeared for certain examinations. 35 students failed in MHT-CET. 40 in AIEEE and 40 in IIT entrance. 20 failed in MHT-CET and AIEEE. 17 in AIEEE and IIT entrance. 15 in MHT-CET and IIT entrance and 5 failed in all three examinations.
Find how many students.
a)did not fail in any examination.
b)failed in AIEEE or IIT entrance.
Answer
624.9k+ views
Hint: For solving this problem, first draw the Venn diagram of the situation by analysing the statement provided in the problem. Now we assign different values to different parts of the circle. By using this data representation, we can easily evaluate our answer.
Complete step-by-step answer:
A Venn diagram is a simple representation of data in the form of a circle having a quantified value. Venn diagrams, also called Set diagrams or Logic diagrams, are widely used in mathematics, statistics, logic, teaching, linguistics, computer science and business. It is very helpful to illustrate the relationships between the sets.
For, our case, the Venn diagram can be illustrated as:
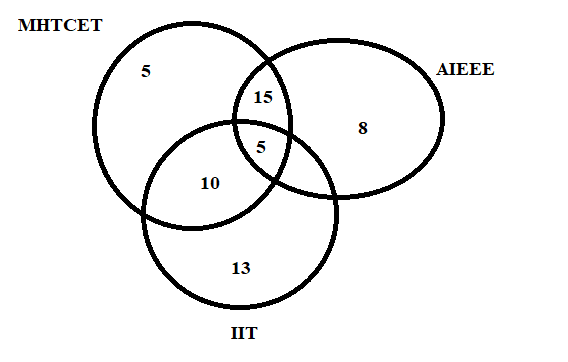
By observing the various sets, we get
Students failed in MHT-CET $=35$ students.
Students failed in AIEEE $=40$ students.
Students failed in IIT $=40$ students.
Students failed in MHE-CET and AIEEE $=20$ students.
Students failed in MHT-CET and IIT $=15$students.
Students failed in all entrance $=5$ students.
a)Students did not fail in any examination = Total number of students – total number of students fail in one or more entrances.
Students did not fail in any examination = 200 – 68 = 132 students.
b)Students failed in AIEEE or IIT is individual sum of students failed in AIEEE and IIT subtracted by the common students in both:
$\begin{align}
& =40+40-17 \\
& =63 \\
\end{align}$
Hence, 63 students failed in one of the exams.
Note: The key concept for solving this problem is the knowledge of Venn diagrams. Venn diagram is a very helpful tool for analysing data. It helps the student to solve a problem without using any mathematical formulation.
Complete step-by-step answer:
A Venn diagram is a simple representation of data in the form of a circle having a quantified value. Venn diagrams, also called Set diagrams or Logic diagrams, are widely used in mathematics, statistics, logic, teaching, linguistics, computer science and business. It is very helpful to illustrate the relationships between the sets.
For, our case, the Venn diagram can be illustrated as:
By observing the various sets, we get
Students failed in MHT-CET $=35$ students.
Students failed in AIEEE $=40$ students.
Students failed in IIT $=40$ students.
Students failed in MHE-CET and AIEEE $=20$ students.
Students failed in MHT-CET and IIT $=15$students.
Students failed in all entrance $=5$ students.
a)Students did not fail in any examination = Total number of students – total number of students fail in one or more entrances.
Students did not fail in any examination = 200 – 68 = 132 students.
b)Students failed in AIEEE or IIT is individual sum of students failed in AIEEE and IIT subtracted by the common students in both:
$\begin{align}
& =40+40-17 \\
& =63 \\
\end{align}$
Hence, 63 students failed in one of the exams.
Note: The key concept for solving this problem is the knowledge of Venn diagrams. Venn diagram is a very helpful tool for analysing data. It helps the student to solve a problem without using any mathematical formulation.
Recently Updated Pages
Basicity of sulphurous acid and sulphuric acid are
Master Class 11 Business Studies: Engaging Questions & Answers for Success
Master Class 11 Computer Science: Engaging Questions & Answers for Success
Master Class 11 Economics: Engaging Questions & Answers for Success
Master Class 12 English: Engaging Questions & Answers for Success
Master Class 12 Social Science: Engaging Questions & Answers for Success
Trending doubts
Which country won the ICC Men's ODI World Cup in 2023?
In cricket, how many legal balls are there in a standard over?
Explain the Treaty of Vienna of 1815 class 10 social science CBSE
A boat goes 24 km upstream and 28 km downstream in class 10 maths CBSE
What does "powerplay" mean in limited-overs cricket?
What is the "Powerplay" in T20 cricket?