


If $I,II$ and $III$ are three isotherms respectively at temperature ${T_1},{T_2}$ and ${T_3}$, then temperature will be in order:
A. ${T_1} = {T_2} = {T_3}$
B. ${T_1} > {T_2} = {T_3}$
C. ${T_1} > {T_2} > {T_3}$
D. ${T_1} < {T_2} < {T_3}$
Answer
575.1k+ views
Hint:The ideal gas laws which depict the relationship between Pressure, Volume and Temperature needs to be taken into account. These are the physical variables for the different gases and hence the variable values and the constant values need to be determined.
Complete step by step answer:
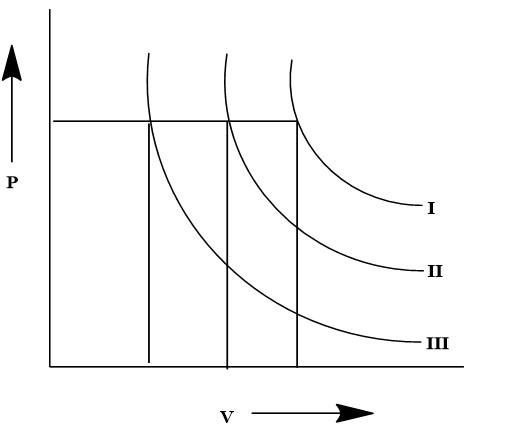
The given graph is a depiction of isotherm in a $P - V$ diagram for three different temperatures, which are depicted by three specific isotherm curves. The isotherms are formed based on the specific pressure and volume at the given three temperatures, which are ${T_1},{T_2}$ and ${T_3}$. It is previously known from the ideal gas laws that the Pressure and Volume have a proportional relation with Temperature. Here three temperatures are given which are ${T_1},{T_2}$ and ${T_3}$.

Here from the given graph, it is visible that there is a single pressure level that is maintained for all the three isotherms. However, the volume changes with each isotherm as visible from the perpendicular dropped from the isotherm. The highest volume is observed from the isotherm denoted by ${T_1}$ and the lowest volume is observed for the isotherm denoted by ${T_3}$. It is known from ideal gas laws: $PV = nRT$
Therefore, taking the physical factors into account, if the pressure is constant then the changes in volume will define the different temperatures for which the isotherms are created. Therefore the comparative data let us consider the volume for ${T_1}$ temperature for the isotherm $I$ is ${V_1}$. Similarly for ${T_2}$ the volume will be ${V_2}$ and for that of ${T_3}$ the volume will be ${V_3}$. Hence according to the data from the volume axis, we can get: ${V_1} > {V_2} > {V_3}$
This proves that the trend in the isotherms and the temperature of the isotherm will be ${T_1} > {T_2} > {T_3}$ which can be proved to be $V \propto T$ as the relation for the given $P - V$ diagram. Therefore, the relationship between the isotherms can be defined by C. ${T_1} > {T_2} > {T_3}$.
Note:
There are three isotherms which are plotted for three specific temperatures. The $P - V$ diagram is used to determine the changes in the gases and hence based on the given plot the condition can be determined.
Complete step by step answer:
The given graph is a depiction of isotherm in a $P - V$ diagram for three different temperatures, which are depicted by three specific isotherm curves. The isotherms are formed based on the specific pressure and volume at the given three temperatures, which are ${T_1},{T_2}$ and ${T_3}$. It is previously known from the ideal gas laws that the Pressure and Volume have a proportional relation with Temperature. Here three temperatures are given which are ${T_1},{T_2}$ and ${T_3}$.
Here from the given graph, it is visible that there is a single pressure level that is maintained for all the three isotherms. However, the volume changes with each isotherm as visible from the perpendicular dropped from the isotherm. The highest volume is observed from the isotherm denoted by ${T_1}$ and the lowest volume is observed for the isotherm denoted by ${T_3}$. It is known from ideal gas laws: $PV = nRT$
Therefore, taking the physical factors into account, if the pressure is constant then the changes in volume will define the different temperatures for which the isotherms are created. Therefore the comparative data let us consider the volume for ${T_1}$ temperature for the isotherm $I$ is ${V_1}$. Similarly for ${T_2}$ the volume will be ${V_2}$ and for that of ${T_3}$ the volume will be ${V_3}$. Hence according to the data from the volume axis, we can get: ${V_1} > {V_2} > {V_3}$
This proves that the trend in the isotherms and the temperature of the isotherm will be ${T_1} > {T_2} > {T_3}$ which can be proved to be $V \propto T$ as the relation for the given $P - V$ diagram. Therefore, the relationship between the isotherms can be defined by C. ${T_1} > {T_2} > {T_3}$.
Note:
There are three isotherms which are plotted for three specific temperatures. The $P - V$ diagram is used to determine the changes in the gases and hence based on the given plot the condition can be determined.
Recently Updated Pages
Basicity of sulphurous acid and sulphuric acid are
Master Class 11 Business Studies: Engaging Questions & Answers for Success
Master Class 11 Computer Science: Engaging Questions & Answers for Success
Master Class 11 Economics: Engaging Questions & Answers for Success
Master Class 11 Social Science: Engaging Questions & Answers for Success
Master Class 11 English: Engaging Questions & Answers for Success
Trending doubts
One Metric ton is equal to kg A 10000 B 1000 C 100 class 11 physics CBSE
The largest wind power cluster is located in the state class 11 social science CBSE
Explain zero factorial class 11 maths CBSE
What steps did the French revolutionaries take to create class 11 social science CBSE
Which among the following are examples of coming together class 11 social science CBSE
Can anyone list 10 advantages and disadvantages of friction