


If f (x) = max (x, $\dfrac{1}{x}$) for x > 0, where max (a, b) denotes the greater of the two real numbers a and b. Define the function g (x) = f (x) f ($\dfrac{1}{x}$) and plot its graph.
Answer
640.2k+ views
Hint: We will first define max {m (x), n (x)} and them we will divide the function f (x) = max (x, $\dfrac{1}{x}$) into two sub – intervals namely x > $\dfrac{1}{x}$and x < $\dfrac{1}{x}$. Then we will plot the graphs of both x and $\dfrac{1}{x}$. Then, we will define the function f (x) = max (x, $\dfrac{1}{x}$)and then using it,
we can define f (x) = max ( $\dfrac{1}{x}$, x) and thereby we can define g (x) = f (x) f ($\dfrac{1}{x}$).
Complete step-by-step answer:
We are given f (x) = max (x, $\dfrac{1}{x}$).
We can define the function p (x) = max {m (x), n (x)} as
p (x) = $\left\{ {\begin{array}{*{20}{c}}
{m\left( x \right);m\left( x \right) > n\left( x \right)} \\
{n\left( x \right);n\left( x \right) > m\left( x \right)}
\end{array}} \right.$
Hence, we can define the given function f (x) = max (x, $\dfrac{1}{x}$)if we divide it into two sub – intervals as x > $\dfrac{1}{x}$and x < $\dfrac{1}{x}$. We can plot the graph of x and $\dfrac{1}{x}$ at the same graph, hence determining the exact functional form.
Graph:

In the graph, the blue curve represents the graph of $\dfrac{1}{x}$ and the red line represents the graph of x.
From the graph and by the definition of p (x) = max {m (x), n (x)}, we can say that
$ \Rightarrow $f (x) = max (x, $\dfrac{1}{x}$) = $\left\{ {\begin{array}{*{20}{c}}
{\dfrac{1}{x};x \in \left( {0,1} \right]} \\
{x;x \in \left[ {1,\infty } \right)}
\end{array}} \right.$
We can say that f (x) = max ($\dfrac{1}{x}$, x) = $\left\{ {\begin{array}{*{20}{c}}
{\dfrac{1}{x};x \in \left( {0,1} \right]} \\
{x;x \in \left[ {1,\infty } \right)}
\end{array}} \right.$
We can check by assuming x = 3 or 4 and $\dfrac{1}{3}$or $\dfrac{1}{4}$(just for example)
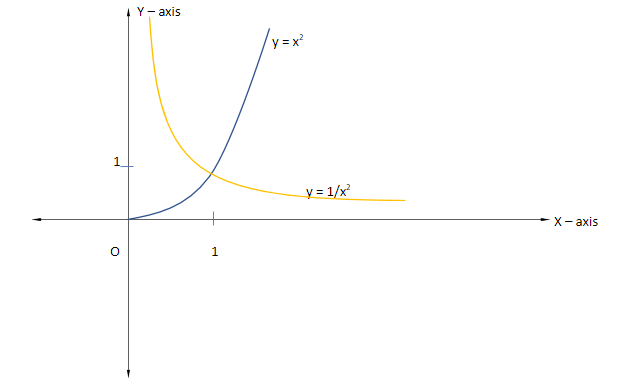
Therefore, g (x) = f (x) f ($\dfrac{1}{x}$) can be defined as:
$ \Rightarrow $ g (x) = f (x) f ($\dfrac{1}{x}$) = $\left\{ {\begin{array}{*{20}{c}}
{\dfrac{1}{{{x^2}}};x \in \left( {0,1} \right]} \\
{{x^2};x \in \left[ {1,\infty } \right)}
\end{array}} \right.$
Now, we can plot its graph as:
Note: In such questions, you may get confused while defining the functions and their range. Be careful in plotting the graphs of all the four functions and defining the acceptable region. You can also solve the first part of the question by defining the range of the function x and $\dfrac{1}{x}$ instead of plotting the graph.
we can define f (x) = max ( $\dfrac{1}{x}$, x) and thereby we can define g (x) = f (x) f ($\dfrac{1}{x}$).
Complete step-by-step answer:
We are given f (x) = max (x, $\dfrac{1}{x}$).
We can define the function p (x) = max {m (x), n (x)} as
p (x) = $\left\{ {\begin{array}{*{20}{c}}
{m\left( x \right);m\left( x \right) > n\left( x \right)} \\
{n\left( x \right);n\left( x \right) > m\left( x \right)}
\end{array}} \right.$
Hence, we can define the given function f (x) = max (x, $\dfrac{1}{x}$)if we divide it into two sub – intervals as x > $\dfrac{1}{x}$and x < $\dfrac{1}{x}$. We can plot the graph of x and $\dfrac{1}{x}$ at the same graph, hence determining the exact functional form.
Graph:
In the graph, the blue curve represents the graph of $\dfrac{1}{x}$ and the red line represents the graph of x.
From the graph and by the definition of p (x) = max {m (x), n (x)}, we can say that
$ \Rightarrow $f (x) = max (x, $\dfrac{1}{x}$) = $\left\{ {\begin{array}{*{20}{c}}
{\dfrac{1}{x};x \in \left( {0,1} \right]} \\
{x;x \in \left[ {1,\infty } \right)}
\end{array}} \right.$
We can say that f (x) = max ($\dfrac{1}{x}$, x) = $\left\{ {\begin{array}{*{20}{c}}
{\dfrac{1}{x};x \in \left( {0,1} \right]} \\
{x;x \in \left[ {1,\infty } \right)}
\end{array}} \right.$
We can check by assuming x = 3 or 4 and $\dfrac{1}{3}$or $\dfrac{1}{4}$(just for example)
Therefore, g (x) = f (x) f ($\dfrac{1}{x}$) can be defined as:
$ \Rightarrow $ g (x) = f (x) f ($\dfrac{1}{x}$) = $\left\{ {\begin{array}{*{20}{c}}
{\dfrac{1}{{{x^2}}};x \in \left( {0,1} \right]} \\
{{x^2};x \in \left[ {1,\infty } \right)}
\end{array}} \right.$
Now, we can plot its graph as:
Note: In such questions, you may get confused while defining the functions and their range. Be careful in plotting the graphs of all the four functions and defining the acceptable region. You can also solve the first part of the question by defining the range of the function x and $\dfrac{1}{x}$ instead of plotting the graph.
Recently Updated Pages
Basicity of sulphurous acid and sulphuric acid are
Master Class 12 Economics: Engaging Questions & Answers for Success
Master Class 12 Biology: Engaging Questions & Answers for Success
Master Class 11 English: Engaging Questions & Answers for Success
Master Class 11 Physics: Engaging Questions & Answers for Success
Master Class 11 Computer Science: Engaging Questions & Answers for Success
Trending doubts
Draw a labelled sketch of the human eye class 12 physics CBSE
The chemical formula of tear gas is A CO Cl 2 B C 10 class 12 chemistry CBSE
Draw ray diagrams each showing i myopic eye and ii class 12 physics CBSE
Which are the Top 10 Largest Countries of the World?
Differentiate between homogeneous and heterogeneous class 12 chemistry CBSE
Which is the correct genotypic ratio of mendel dihybrid class 12 biology CBSE